

Index
Share
A crypto Index provides a way for investors to gain diversified exposure to a specific basket of digital assets through a single tokenized product. These indices often track specific sectors, such as DeFi, DePIN, or RWA, and are automatically rebalanced via smart contracts. In 2026, AI-managed thematic indices have become the gold standard for passive investing, allowing users to track the "blue chips" of the Web3 economy without manual portfolio management. This tag covers index methodology, rebalancing frequency, and the benefits of diversified crypto baskets.
25052 Articles
Created: 2026/02/02 18:52
Updated: 2026/02/02 18:52
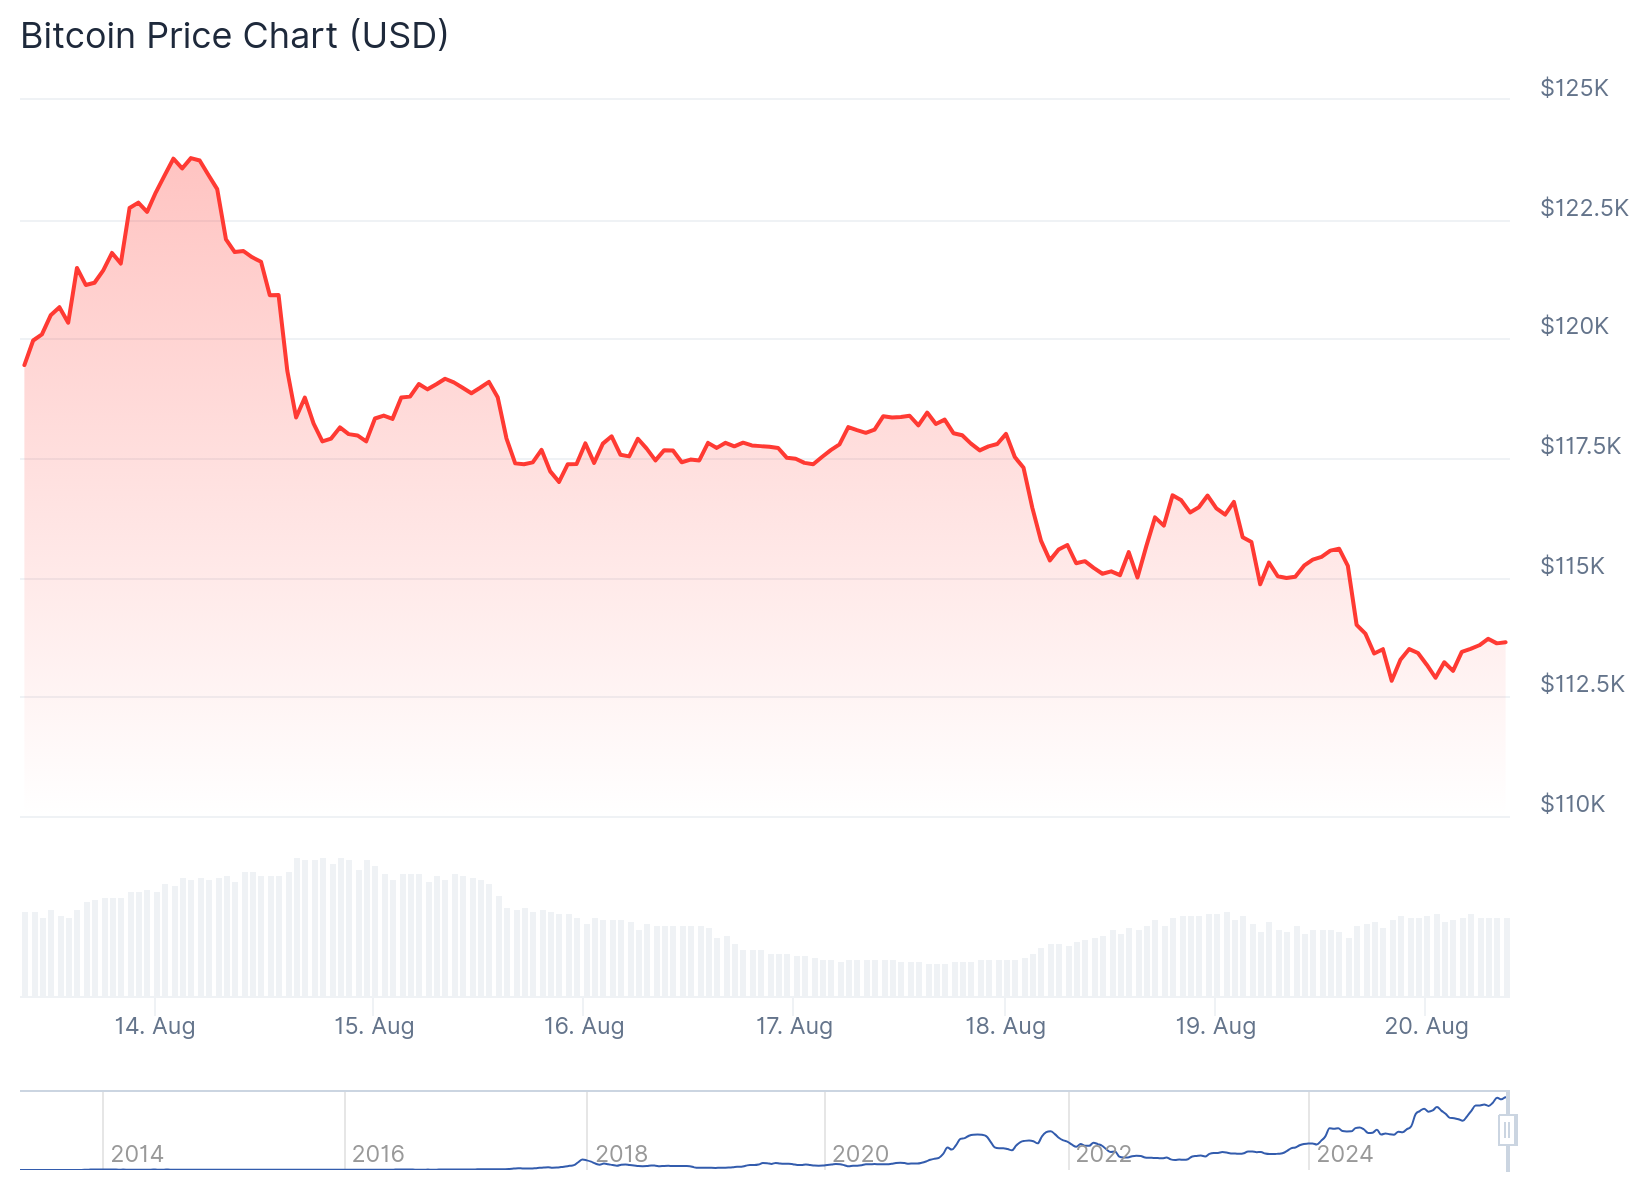
Why is Crypto Down Today? Let’s Dive In
Author: Coincentral
2025/08/20
Share


Recommended by active authors

Latest Articles

Solana Price Analysis: Wyckoff Spring Eyes $120 Liquidity Break
2026/02/05 01:43

Vitalik Buterin Says Ethereum Scaling Should Move From L2s
2026/02/05 01:43

What is the best front-office digital software for insurance companies in 2026?
2026/02/05 01:37

Xi Jinping Vows China Will Never Allow Taiwan to Separate, Reigniting Global Tensions
2026/02/05 01:11

Solana (SOL) to $150? Latest 43% Boost in Volume Might Fuel Rebound
2026/02/05 00:46