

ETF
Share
A crypto ETF is a regulated investment fund that tracks the price of one or more digital assets and trades on traditional stock exchanges like the NYSE or Nasdaq.Following the success of Bitcoin and Ethereum ETFs, the 2026 market now includes Solana ETFs and diversified Altcoin Baskets. ETFs serve as the primary vehicle for institutional capital and retirement funds (401k/IRA) to enter the Web3 space. This tag tracks regulatory approvals, AUM (Assets Under Management) inflows, and the impact of Wall Street on crypto liquidity.
39468 Articles
Created: 2026/02/02 18:52
Updated: 2026/02/02 18:52


Can the Fed afford to slash interest rates?
Author: Medium
2025/08/20
Share


Recommended by active authors

Latest Articles

Solana Price Drops, But Open Interest Signals Growing Activity
2026/02/05 23:30
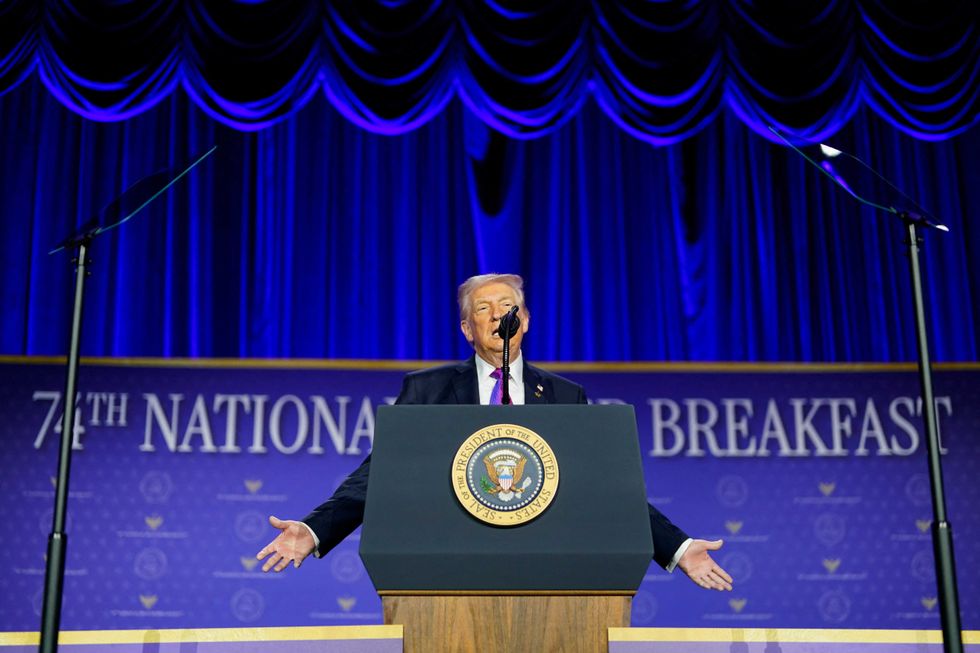
Trump turns National Prayer Breakfast into partisan hit on Democrats of faith
2026/02/05 23:18
Where Can You Turn $1,000 Into $5,000 This Week? Experts Point Towards Remittix As The Best Option
2026/02/05 23:13

Trump roasts Mike Johnson for saying grace at prayer event: 'Excuse me, it's lunch!'
2026/02/05 23:11
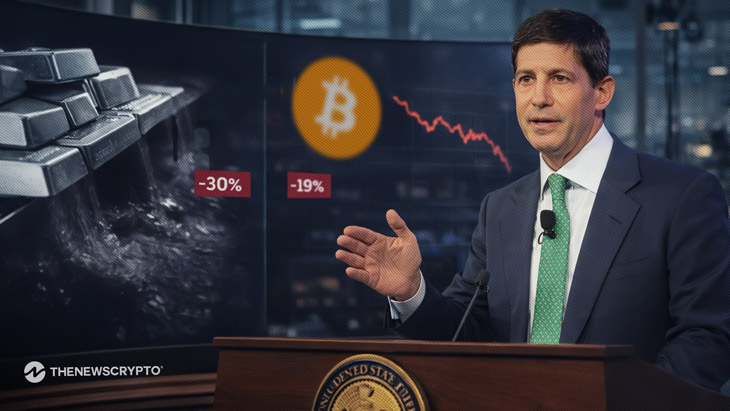
Silver and BTC Prices Tumble, Attributions Loosely Hang on Kevin Warsh
2026/02/05 19:35