Its the last week in March 2026 and the crypto market is in one of those weird consolidation phases. You’ve got huge institutional money pouring in, a major shiftIts the last week in March 2026 and the crypto market is in one of those weird consolidation phases. You’ve got huge institutional money pouring in, a major shift

Grok AI Predicts the Price of XRP, Ethereum, and Solana by The End of 2026

2026/03/27 00:00
5 min read
For feedback or concerns regarding this content, please contact us at [email protected]

Its the last week in March 2026 and the crypto market is in one of those weird consolidation phases. You’ve got huge institutional money pouring in, a major shift in how the government classifies these assets, but also some serious economic headwinds making everyone a little jittery. It’s a tug-of-war between long-term optimism and short-term fear.

XRP, Solana (SOL), and Ethereum (ETH) are all feeling the effects right now. The biggest news is from March 17, when the SEC and CFTC finally agreed to classify BTC, ETH, XRP, SOL, and a dozen other tokens as digital commodities. 

That’s a huge deal. It clears up years of legal uncertainty and opens the door for things like spot ETFs, especially for XRP, which has been stuck in litigation hell for what feels like forever.

But it’s not all smooth sailing. The Federal Reserve is still talking about keeping interest rates “higher for longer,” and geopolitical tensions, like the ongoing US-Iran situation, are making investors nervous. 

People are taking profits, and even the AI stock craze is making everyone go “risk off,” and that’s affecting crypto as well, particularly altcoins. So, while the foundation is getting stronger by the day, the day-to-day price action is a bit of a mess.

Given all this, we decided to cut through the noise and ask Grok AI for some straight answers. We wanted to know where the smart money thinks XRP, Ethereum, and Solana will be by the end of 2026. Let’s dive into the charts and see what the AI predicted.

XRP Price Analysis and Prediction

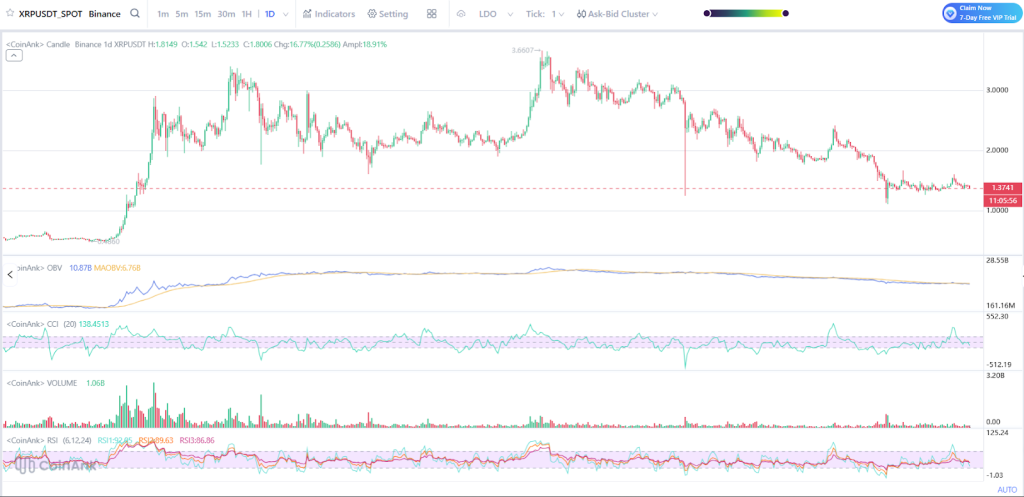
First, let’s look at XRP. The daily chart shows a huge green candle, with the price trading around $1.80. It’s up over 16% recently, bouncing off a low of $1.52. 

That kind of move shows there’s still a lot of aggressive buying pressure, even after a long period of consolidation. The trading volume is healthy, sitting over a billion, which supports the idea that this isn’t just a quick pump.

The (OBV, which measures the buying and selling pressure, has a strong uptrend, indicating investors are buying. The CCI is also high at 138. This tells us that the XRP price is moving with high momentum, well above its statistical average. In other words, XRP has broken out of its range and looks bullish.

Source; Coinank

Now, for the price prediction. Grok AI analyzed the upcoming catalysts for XRP, including its CBDC platform expansion into new international markets, enhanced interoperability with Ethereum and Cosmos, and the launch of its enterprise NFT and tokenization suite. 

With these developments driving real-world asset issuance and DeFi capital onto the network, Grok’s forecast is that XRP will trade in a range of $3.80 to $5.20 by December 2026.

Source: Grok AI

Ethereum Price Analysis and Prediction

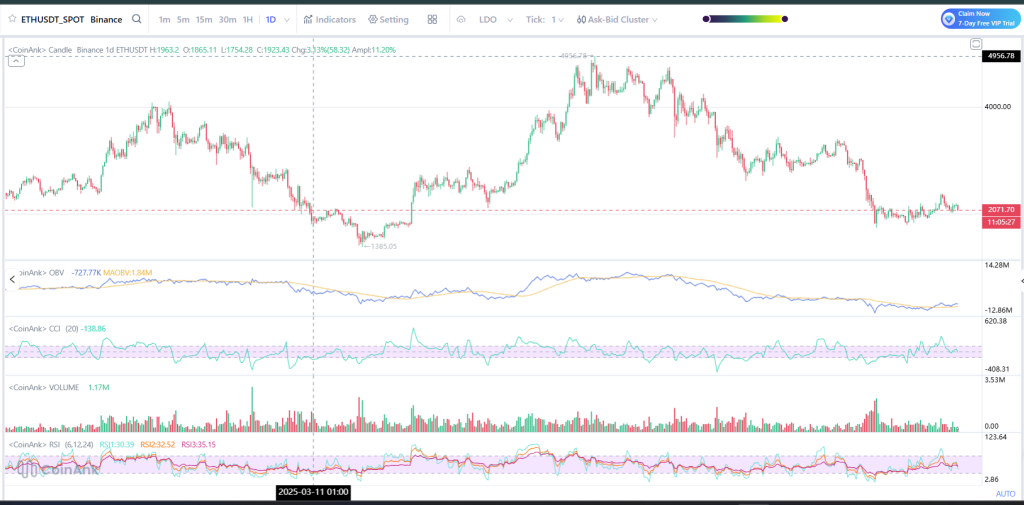
Ethereum’s chart tells a slightly different story. It’s trading around $1,923, which is up a bit, but it’s still struggling. The chart shows a long wick to the downside recently, hitting a low of $1,754, which indicates sellers tried to push it much lower but buyers stepped in.

The problem is, the ETH price is still stuck in a range, facing a lot of resistance between $2,388 and $2,500.

Looking at the indicators, the OBV is actually negative, sitting at -727K, which suggests selling pressure has been outweighing buying pressure. The CCI is also deep in negative territory at -138, confirming that the momentum is currently bearish. 

While Ethereum has strong institutional backing, like BlackRock’s recent accumulation, the chart shows it’s having a harder time finding a solid footing compared to XRP or Solana right now.

Source; Coinank

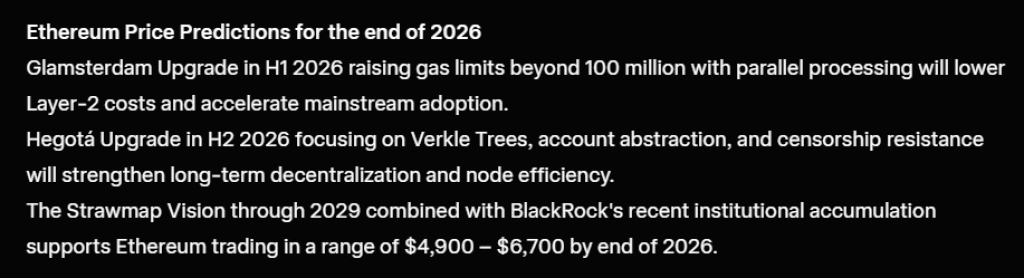
However, Grok AI is looking past the current weakness. It focused on Ethereum’s upcoming technical roadmap, specifically the Glamsterdam Upgrade in H1 2026, which will raise gas limits and lower Layer-2 costs, and the Hegota Upgrade in H2 2026, which will introduce Verkle Trees and improve decentralization. 

With the long-term Strawmap Vision and strong institutional interest, Grok predicts that the Ethereum price could trade in a range of $4,900 to $6,700 by the end of 2026.

Read Also: Can Binance Coin (BNB) Deliver an 8x Move to $5,000 Next Altseason?

Source: Grok AI

Solana Price Analysis and Prediction

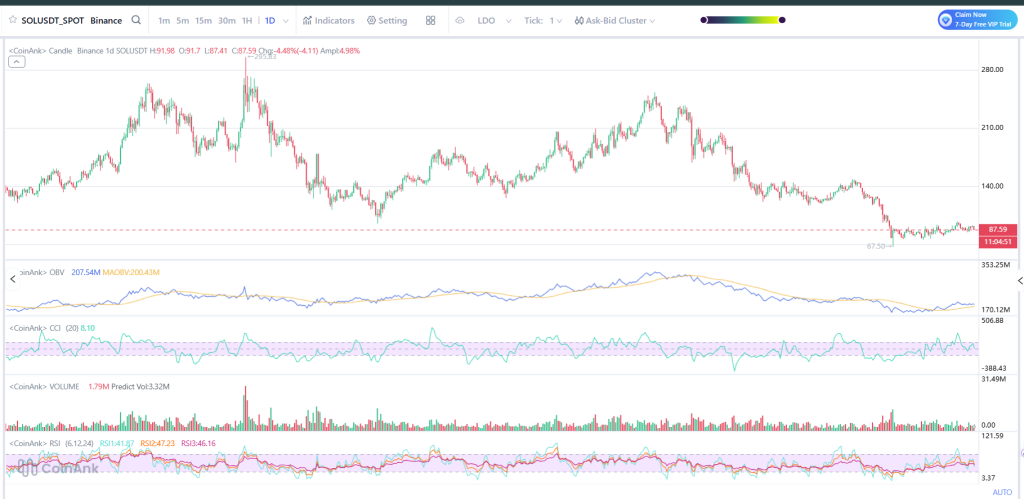
Solana’s chart is showing a story of resilience. The price is trading around $87.59, and the chart indicates it has found a strong base. 

The trading volume is solid, and the price action is coiling, which often signals a big move is coming. While it hasn’t exploded upward yet, the chart doesn’t show the same heavy selling pressure we see on Ethereum.

Source; Coinank

The OBV is trending positively at 207M, showing that smart money is quietly accumulating SOL. The CCI is neutral at 8.10, meaning it’s not overbought or oversold, it’s in a perfect spot to make a move. 

The RSI indicators are all below 50, which tells us there’s plenty of room for the price to run up without being considered overextended. Technically, the SOL price is set up for a potential breakout.

Source: Grok AI

Grok AI’s prediction for Solana highlights the critical validator security patch and SIMD-0334 efficiency fixes from early 2026, which enhance network reliability. The real game-changer, however, is the Alpenglow Consensus Overhaul in Q3 2026, which will deliver near-instant 150ms finality. 

Combined with partnerships like Zepz remittances and Goldman Sachs’ $108M SOL ETF stake, Grok forecasts the Solana price trading between $210 and $290 by December 2026.

Subscribe to our YouTube channel for daily crypto updates, market insights, and expert analysis.

The post Grok AI Predicts the Price of XRP, Ethereum, and Solana by The End of 2026 appeared first on CaptainAltcoin.

Market Opportunity
GROK Logo
GROK Price(GROK)
$0.0004403
$0.0004403$0.0004403
+1.61%
USD
GROK (GROK) Live Price Chart
Disclaimer: The articles reposted on this site are sourced from public platforms and are provided for informational purposes only. They do not necessarily reflect the views of MEXC. All rights remain with the original authors. If you believe any content infringes on third-party rights, please contact [email protected] for removal. MEXC makes no guarantees regarding the accuracy, completeness, or timeliness of the content and is not responsible for any actions taken based on the information provided. The content does not constitute financial, legal, or other professional advice, nor should it be considered a recommendation or endorsement by MEXC.

You May Also Like

Nvidia Faces Class Action Over Alleged Hidden Crypto GPU Revenue

Nvidia Faces Class Action Over Alleged Hidden Crypto GPU Revenue

Nvidia faces class action over alleged $1B undisclosed crypto GPU revenue; investors gain approval to proceed as a group. Nvidia faces a certified class action
Share
LiveBitcoinNews2026/03/27 02:30
Ethereum koers toont zeldzaam dubbel koopsignaal en richt zich op $4.550

Ethereum koers toont zeldzaam dubbel koopsignaal en richt zich op $4.550

Connect met Like-minded Crypto Enthusiasts! Connect op Discord! Check onze Discord   Ethereum laat op de uurgrafiek twee opeenvolgende TD Sequential koopsignalen zien. Deze indicator meet uitputting in een trend en geeft vaak een signaal dat de verkoopdruk kan afnemen. Dit dubbele signaal verschijnt rond het niveau van $4.516, waar de ETH prijs kortstondig steun vindt. Dit type formatie komt zelden voor en wordt daarom extra nauwlettend gevolgd. Wat gaat de Ethereum koers hiermee doen? Ethereum koers test steun rond $4.516 De scherpe daling van de Ethereum koers vanaf de prijszone rond $4.800 bracht de ETH prijs in korte tijd naar ongeveer $4.516. Op dit niveau trad duidelijke koopactiviteit op, waardoor de neerwaartse beweging tijdelijk werd gestopt. Het dubbele signaal dat door de TD Sequential indicator is gegenereerd, viel precies samen met dit prijspunt. De TD Sequential is opgebouwd uit negen candles die een trend meetellen. Wanneer de negende candle verschijnt, kan dit duiden op een trendomslag. In dit geval verschenen zelfs twee signalen kort na elkaar, wat aangeeft dat de verkoopdruk mogelijk uitgeput is. Het feit dat dit gebeurde in een zone waar ETH kopers actief bleven, maakt het patroon extra opvallend. TD Sequential just flashed two buy signals for Ethereum $ETH! pic.twitter.com/JPO8EhiEPi — Ali (@ali_charts) September 16, 2025 Welke crypto nu kopen?Lees onze uitgebreide gids en leer welke crypto nu kopen verstandig kan zijn! Welke crypto nu kopen? Fed-voorzitter Jerome Powell heeft aangekondigd dat de rentes binnenkort zomaar eens omlaag zouden kunnen gaan, en tegelijkertijd blijft BlackRock volop crypto kopen, en dus lijkt de markt klaar om te gaan stijgen. Eén vraag komt telkens terug: welke crypto moet je nu kopen? In dit artikel bespreken we de munten die… Continue reading Ethereum koers toont zeldzaam dubbel koopsignaal en richt zich op $4.550 document.addEventListener('DOMContentLoaded', function() { var screenWidth = window.innerWidth; var excerpts = document.querySelectorAll('.lees-ook-description'); excerpts.forEach(function(description) { var excerpt = description.getAttribute('data-description'); var wordLimit = screenWidth wordLimit) { var trimmedDescription = excerpt.split(' ').slice(0, wordLimit).join(' ') + '...'; description.textContent = trimmedDescription; } }); }); Technische indicatoren schetsen herstelkans voor ETH Naast de dubbele koopsignalen verstrekken ook andere indicatoren belangrijke aanwijzingen. Tijdens de daling van de ETH koers waren grote rode candles zichtbaar, maar na de test van $4.516 stabiliseerde de Ethereum koers. Dit wijst op een mogelijke verschuiving in het evenwicht tussen de bears en bulls. Als deze opwaartse beweging doorzet, liggen de eerste weerstanden rond $4.550. Daarboven wacht een sterkere zone rond $4.650. Deze niveaus zijn in eerdere Ethereum sessies al meerdere keren getest. Een doorbraak zou ruimte openen richting de all-time high van ETH rond $4.953. Wanneer de prijs toch opnieuw onder $4.516 zakt, liggen er zones rond $4.500 en $4.450 waar grotere kooporders worden verwacht. Deze niveaus kunnen als een vangnet fungeren, mocht de druk opnieuw toenemen. Marktdynamiek bevestigt technische indicatoren De huidige situatie volgt op een bredere correctie in de cryptomarkt. Verschillende vooraanstaande crypto tokens zagen scherpe koersdalingen, waarna traders op zoek gingen naar signalen voor een mogelijke ommekeer. Dat juist Ethereum nu een dubbel TD Sequential signaal toont, versterkt de interesse in dit scenario. Fundamenteel blijft Ethereum sterk. Het aantal ETH tokens dat via staking is vastgezet, blijft groeien. Dat verkleint de vrije circulatie en vermindert verkoopdruk. Tegelijk blijft het netwerk intensief gebruikt voor DeFi, NFT’s en stablecoins. Deze activiteiten zorgen voor een stabiele vraag naar ETH, ook wanneer de prijs tijdelijk onder druk staat. Fundamentele drijfveren achter de Ethereum koers De Ethereum koers wordt echter niet alleen bepaald door candles en patronen, maar ook door bredere factoren. Een stijgend percentage van de totale ETH supply staat vast in staking contracten. Hierdoor neemt de liquiditeit op exchanges af. Dit kan prijsschommelingen versterken wanneer er plotseling meer koopdruk ontstaat. Daarnaast is Ethereum nog steeds het grootste smart contract platform. Nieuwe standaarden zoals ERC-8004 en ontwikkelingen rond layer-2 oplossingen houden de activiteit hoog. Deze technologische vooruitgang kan de waardepropositie ondersteunen en zo indirect bijdragen aan een ETH prijsherstel. Het belang van de korte termijn dynamiek De komende handelsdagen zullen duidelijk maken of de bulls genoeg kracht hebben om door de weerstandszone rond $4.550 te breken. Voor de bears ligt de focus juist op het verdedigen van de prijsregio rond $4.516. De whales, die met grote handelsorders opereren, kunnen hierin een beslissende rol spelen. Het dubbele TD Sequential signaal blijft hoe dan ook een zeldzame gebeurtenis. Voor cryptoanalisten vormt het een objectief aanknopingspunt om de kracht van de huidige Ethereum trend te toetsen. Vooruitblik op de ETH koers Ethereum liet twee opeenvolgende TD Sequential signalen zien op de uurgrafiek, iets wat zelden voorkomt. Deze formatie viel samen met steun rond $4.516, waar de bulls actief werden. Als de Ethereum koers boven dit niveau blijft, kan er ruimte ontstaan richting $4.550 en mogelijk $4.650. Zakt de prijs toch opnieuw onder $4.516, dan komen $4.500 en $4.450 in beeld als nieuwe steunzones. De combinatie van zeldzame indicatoren en een sterke fundamentele basis maakt Ethereum interessant voor zowel technische als fundamentele analyses. Of de bulls het momentum echt kunnen overnemen, zal blijken zodra de Ethereum koers de eerstvolgende weerstanden opnieuw test. Koop je crypto via Best Wallet Best wallet is een topklasse crypto wallet waarmee je anoniem crypto kan kopen. Met meer dan 60 chains gesupport kan je al je main crypto coins aanschaffen via Best Wallet. Best wallet - betrouwbare en anonieme wallet Best wallet - betrouwbare en anonieme wallet Meer dan 60 chains beschikbaar voor alle crypto Vroege toegang tot nieuwe projecten Hoge staking belongingen Lage transactiekosten Best wallet review Koop nu via Best Wallet Let op: cryptocurrency is een zeer volatiele en ongereguleerde investering. Doe je eigen onderzoek. Het bericht Ethereum koers toont zeldzaam dubbel koopsignaal en richt zich op $4.550 is geschreven door Dirk van Haaster en verscheen als eerst op Bitcoinmagazine.nl.
Share
Coinstats2025/09/17 23:31
Next-Gen Payments, Prediction Markets, and the Future of US iGaming Infrastructure

Next-Gen Payments, Prediction Markets, and the Future of US iGaming Infrastructure

Payments infrastructure is quietly becoming one of the most important battlegrounds in digital finance.  It rarely gets the same attention as user interfaces or
Share
Techbullion2026/03/27 01:59