How High Could SUI Price Spike in the Next Major Altseason?

SUI price is starting to climb again after holding a key support zone near $0.75, and the latest chart structure now points to a much bigger question. The long-term pattern behind this move suggests that the current recovery may only be the early stage of a larger cycle.
That context matters because SUI has followed a repeating structure since launch. Each deep pullback into support has been followed by strong upward expansions that stretch far beyond expectations.
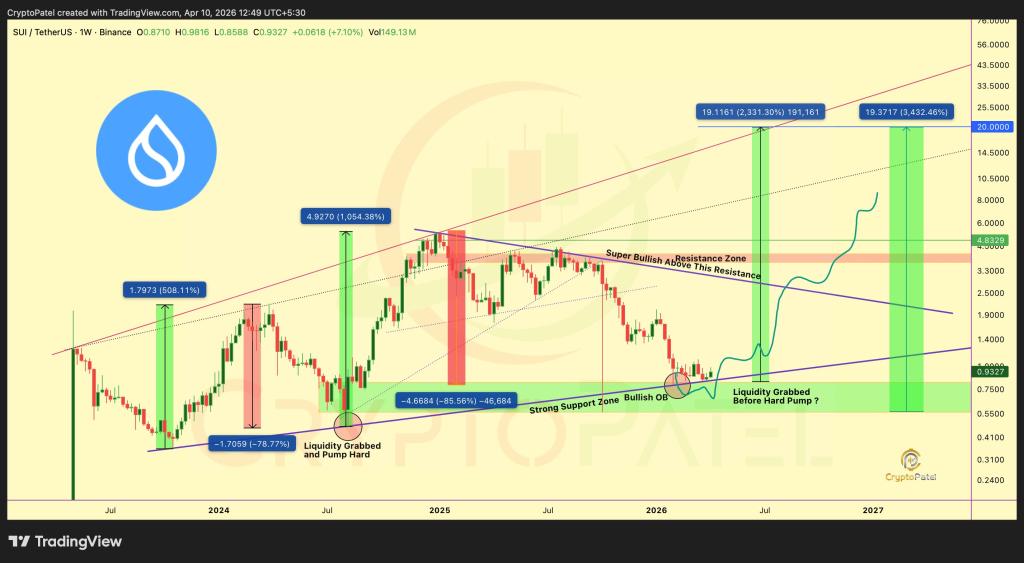
A closer look at the SUI chart reveals a broadening pattern that has been forming since the asset first started trading. This structure is defined by higher highs and lower lows, which creates a widening range that expands over time.
Price recently revisited the lower boundary of this structure near $0.75, which sits inside a strong support zone marked on the chart. That area has acted as a base for previous upward moves, and the current reaction from this level is starting to look similar.
Crypto Patel has pointed out that this type of pattern often leads to aggressive upside phases once price leaves the lower boundary. The chart also shows previous liquidity sweeps near support before sharp upward moves, which adds more weight to the current setup.
 @CryptoPatel / X
Another factor deserves attention. The chart includes a projected path that pushes SUI price toward the $10 to $20 range during the next expansion phase.
Historical Moves Show SUI Price Can Deliver Multi X Gains From Support Zones
Past price action offers a useful reference for what could happen next. Earlier cycles on the chart show strong upward moves after deep corrections.
One previous move delivered over 500% upside. Another move extended beyond 1,000% after a similar liquidity grab near support. Those expansions happened after price tested the lower boundary of the structure.
The current setup follows the same logic. Price has already completed a deep retracement and reclaimed support. That sequence has appeared before each major upward phase.
Crypto Patel emphasized this idea in his projection, noting that once SUI price starts moving with strength, the upside can continue for longer than expected.
Resistance Zone Around $4 Remains The Key Barrier Before Larger Upside
The chart shows a clear resistance zone near $4.80, which has rejected price in the past. A break above this level would change the structure and open the path toward higher targets.
That level now acts as the first major checkpoint. A clean move above it would confirm that buyers have regained control after the prolonged correction phase.
Read Also: Why Buying 550 Internet Computer (ICP) Tokens Today Could Be Like Buying 21 BTC in 2014
Crypto Patel’s projection places the next major upside targets far above this resistance. The chart shows potential extensions toward $10 and even $20 if the pattern completes as expected.
From Current SUI Price To $10 Or $20 Represents A Massive Upside Range
SUI price currently trades close to $0.93, which makes the projected targets stand out even more. A move to $10 would represent roughly a 10x gain from current levels.
A move to $20 would push that expansion closer to a 20x return. Those numbers align with previous expansion phases seen in the same structure, which makes the projection less random than it may appear at first glance.
Read Also: SUI Will Overtake Ethereum: Mysten Labs Co-Founder Makes Bold Call
That reaction reveals something important. Broadening patterns often look chaotic, yet they tend to produce large price swings when momentum returns.
SUI price now sits at a familiar point in its cycle. The structure shows support holding, indicators are turning positive, and the next resistance level is coming into focus.
Subscribe to our YouTube channel for daily crypto updates, market insights, and expert analysis.
The post How High Could SUI Price Spike in the Next Major Altseason? appeared first on CaptainAltcoin.


Ayrıca Şunları da Beğenebilirsiniz

USD: Inflation focus into CPI release – TD Securities

OKX Ventures and HashKey Capital Join CAEX as Strategic Partners to Advance Vietnam’s Regulated Crypto Asset Trading Pilot