Crypto Price Prediction for Today, April 10: XRP, Kaspa (KAS), Bitcoin (BTC)
A calm but decisive tone has settled across the crypto market, and price action over the last 24 hours shows that traders are focusing more on key levels than chasing big moves. XRP, Kaspa, and Bitcoin all moved within defined ranges, which often signals that a larger directional move may be building beneath the surface.
That reaction reveals something important. Markets tend to pause like this when they are deciding whether to continue a trend or reverse it.
XRP Price Holds Key Range As Fibonacci And Pivot Levels Converge
XRP spent the last session trading between $1.32 and $1.369, which aligns closely with our previous predictions. Price now sits around $1.346, showing a sideways structure with a slight upward tilt toward the end of the session.
The daily pivot sits near $1.34, which places current price action right at the center of the market’s balance point. That positioning matters because both support and resistance are tightly packed around this level. Support remains near $1.32, and resistance holds around $1.369.
A look at the Bollinger setup shows price trading near the middle band after failing to move higher on the daily timeframe. The 4-hour view provides a clearer picture for short-term movement. Price recently touched the upper band and moved back toward the middle band, which is now acting as support.
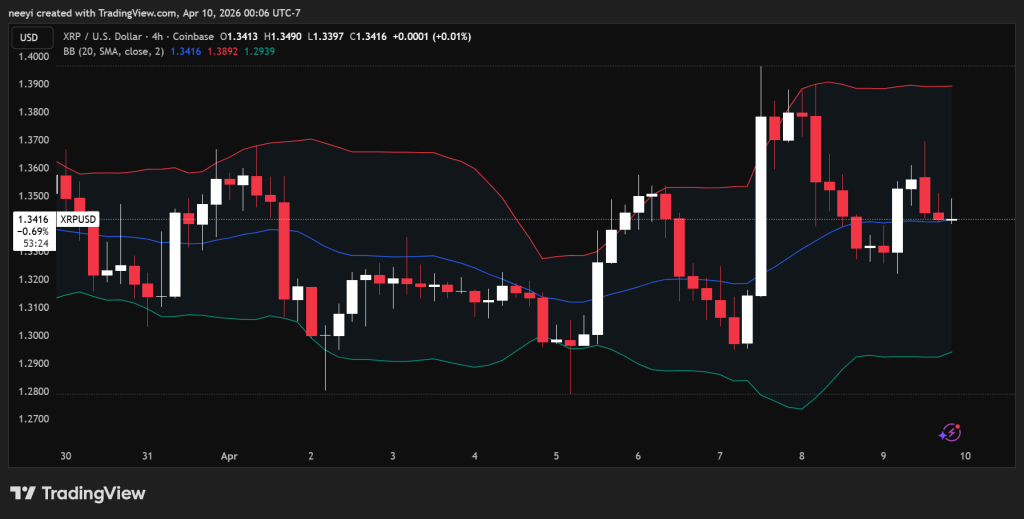
If that middle band holds, upward pressure could return. A move toward $1.39 becomes the next realistic target based on current structure. Failure to hold this level would shift focus back to $1.33, and a break below that opens room toward $1.30.
| Metric | Value |
|---|---|
| Current Price | $1.341 |
| 24H Range | $1.32 – $1.369 |
| Pivot Point | $1.34 |
| Support Levels | $1.32 / $1.30 |
| Resistance Levels | $1.36 / $1.39 |
| Bollinger Position | Near Middle Band (Support Test) |
| Fibonacci Cluster | $1.33 – $1.36 |
Fibonacci levels reinforce this idea. The 50% and 61.8% retracement levels sit around $1.34, which turns this zone into a strong magnet for price. That clustering effect often leads to consolidation before a directional move.
XRP Prediction for Today
- A stable hold above $1.34 keeps the range between $1.33 and $1.39 in play today.
- A push above $1.36 would increase the chances of testing the upper range.
- A move below $1.33 would weaken the structure and expose lower levels.
Kaspa Price Shows Weakness As Bearish Pressure Builds Below Key Average
Kaspa moved within a very tight band between $0.0318 and $0.0325, with current price hovering near $0.03217. That narrow movement signals low volatility, but the underlying structure leans slightly bearish.
The pivot level sits near $0.0321, which places current price almost exactly at equilibrium. Support sits just below at $0.0320 and $0.0319, while resistance appears near $0.0323 and extends toward $0.0330 if volatility increases.
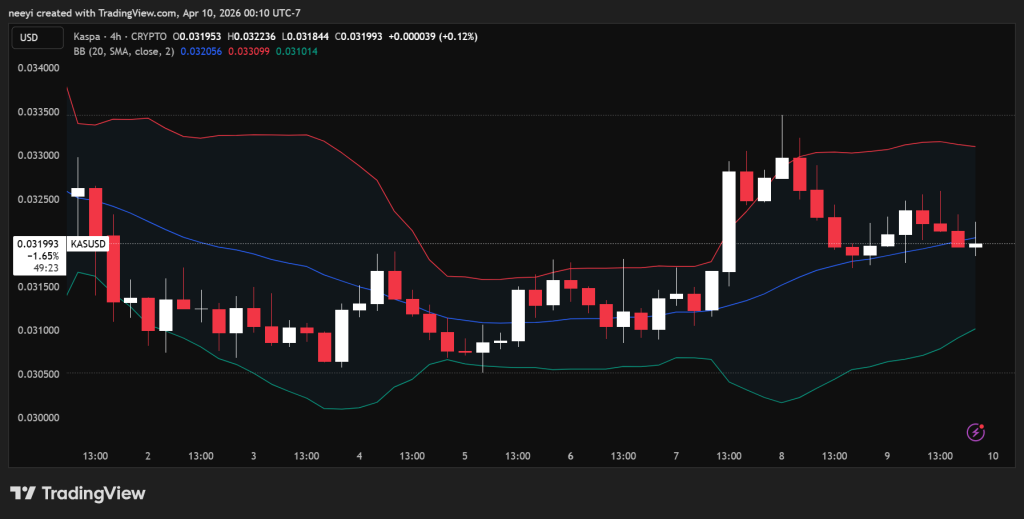
Another factor deserves attention. The Bollinger setup on both the daily and 4-hour timeframe shows price below the middle band. That positioning usually indicates downward pressure, especially when price fails to reclaim the average.
| Metric | Value |
|---|---|
| Current Price | $0.032 |
| 24H Range | $0.0318 – $0.0325 |
| Pivot Point | $0.0321 |
| Support Levels | $0.0319 |
| Resistance Levels | $0.0323 / $0.0330 |
| Bollinger Position | Below Middle Band |
| Fibonacci Levels | $0.03189 – $0.03234 |
Fibonacci levels confirm how tight this structure is. The 50% retracement aligns almost perfectly with the pivot at $0.0321, and the 61.8 percent level sits slightly lower near $0.0320. Price is sitting directly inside this cluster, which makes small movements more meaningful.
KAS Price Prediction for Today
- A hold above $0.0319 keeps the range between $0.0320 and $0.0330 active.
- A clean break below $0.0319 would shift the outlook quickly. That move would expose lower levels around $0.0315 and possibly $0.0310 if selling pressure increases.
Current structure leans slightly bearish, and price needs to reclaim higher levels to change that outlook.
Bitcoin Price Stays Near Pivot As Market Decides Next Direction
Bitcoin traded between $70,550 and $73,170 over the last 24 hours, with price now around $71,950. The movement shows a steady climb after dips, but momentum has slowed near resistance.
The pivot level sits near $72,150, which places current price slightly below it. That position matters because it shows the market is still deciding whether to continue higher or return to lower support levels.
Support remains between $71,000 and $71,100, with deeper support near $70,800. Resistance sits near $72,300 and extends toward the early $73,000 range if buying pressure increases.
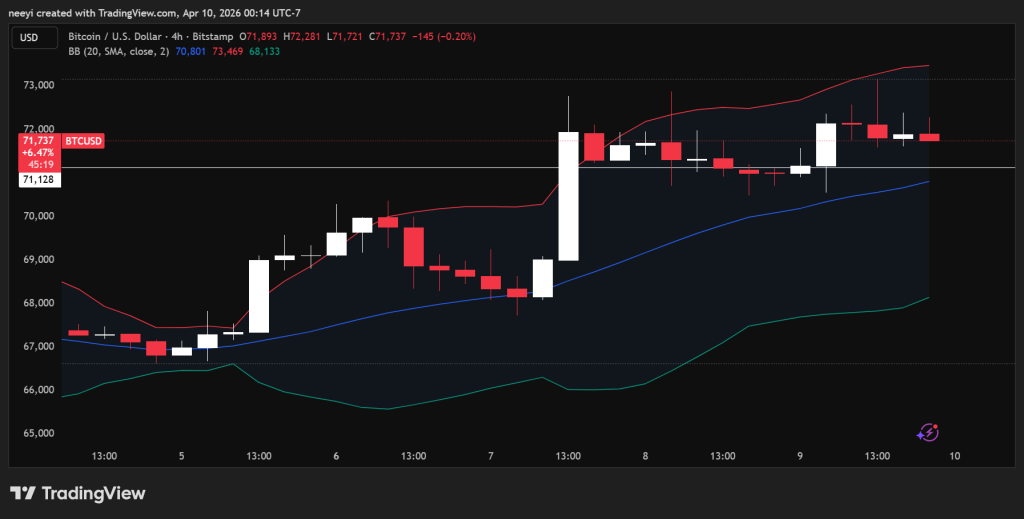
The Bollinger structure shows the upper band acting as resistance. Price has struggled to move beyond that region, which suggests limited upside unless new momentum enters the market.
A return toward the middle band would place price back near the $70,000 to $71,000 range.
| Metric | Value |
|---|---|
| Current Price | $71,950 |
| 24H Range | $70,550 – $73,170 |
| Pivot Point | $72,150 |
| Support Levels | $71,000 / $70,800 |
| Resistance Levels | $72,300 / $73,000 |
| Bollinger Position | Near Upper Band Resistance |
| Fibonacci Cluster | $71,500 – $72,500 |
Fibonacci levels show a key decision zone. The 38.2% and 50% retracement levels sit between $71,853 and $72,162, which aligns closely with the pivot. That cluster turns the $71,500 to $72,500 region into a critical zone.
BTC Price Prediction for Today
- A hold above $71,500 keeps the range between $71,500 and $73,000 active.
- A break below that level would likely send the price toward $71,000 or even $70,800.
Price action across XRP, Kaspa, and Bitcoin shows a common theme. Each asset is trading close to its pivot and major Fibonacci levels, which often leads to consolidation before expansion.
XRP shows a balanced structure with a slight bullish edge if support holds. Kaspa leans bearish unless it reclaims higher levels. Bitcoin remains neutral but sits in a key decision zone that could define the next move.
Subscribe to our YouTube channel for daily crypto updates, market insights, and expert analysis.
The post Crypto Price Prediction for Today, April 10: XRP, Kaspa (KAS), Bitcoin (BTC) appeared first on CaptainAltcoin.


Ayrıca Şunları da Beğenebilirsiniz

USD: Inflation focus into CPI release – TD Securities

OKX Ventures and HashKey Capital Join CAEX as Strategic Partners to Advance Vietnam’s Regulated Crypto Asset Trading Pilot