

Solana (SOL) Maintains Strength, Gradual Gains Signal Bullish Bias
Solana failed to stay above $85 and corrected some gains. SOL price is now consolidating and might aim for another increase above $85.
- SOL price started a downside correction below $84 against the US Dollar.
- The price is now trading above $82 and the 100-hourly simple moving average.
- There is a bullish trend line forming with support at $82.50 on the hourly chart of the SOL/USD pair (data source from Kraken).
- The pair could extend losses if it dips below the $80 zone.
Solana Price Remains Supported
Solana price failed to stay above $85 and started a downside correction, like Bitcoin and Ethereum. SOL dipped below $84 and $83.50 to enter a short-term bearish zone.
There was a move below the 50% Fib retracement level of the upward wave from the $81.42 swing low to the $85.89 high. The price even tested the $83 support. Besides, there is a bullish trend line forming with support at $82.50 on the hourly chart of the SOL/USD pair.
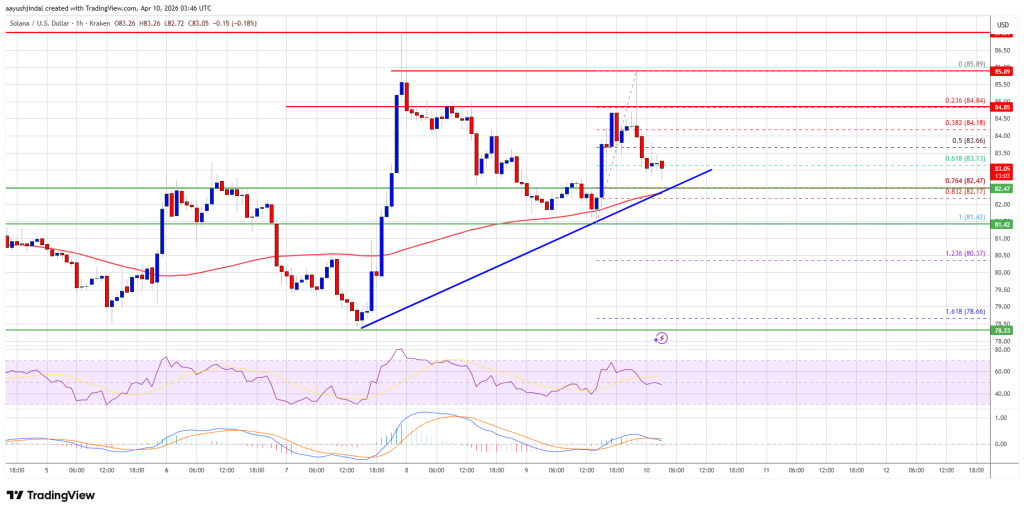
Solana is now trading above $83 and the 100-hourly simple moving average. On the upside, the price is facing resistance near the $84 level. The next major resistance is near the $85 level. The main resistance could be $88. A successful close above the $88 resistance zone could set the pace for another steady increase. The next key resistance is $95. Any more gains might send the price toward the $100 level.
Downside Break In SOL?
If SOL fails to rise above the $85 resistance, it could start another decline. Initial support on the downside is near the $82.5 zone, the trend line, and the 76.4% Fib retracement level of the upward wave from the $81.42 swing low to the $85.89 high. The first major support is near the $81.40 level.
A break below the $81.40 level might send the price toward the $80 support zone. If there is a close below the $80 support, the price could decline toward the $76.50 support in the near term.
Technical Indicators
Hourly MACD – The MACD for SOL/USD is losing pace in the bullish zone.
Hourly Hours RSI (Relative Strength Index) – The RSI for SOL/USD is below the 50 level.
Major Support Levels – $82.50 and $80.00.
Major Resistance Levels – $85.00 and $88.00.


Ayrıca Şunları da Beğenebilirsiniz

XRP Volume Hits Rare Lows, Signals Possible Breakout Ahead

Wall Street and Hollywood Veterans to Launch NEXTRock and SVCV Global in Japan


