

The XRP/BTC Ratio Has a Hidden Cycle And One Analyst Says It Is Repeating Right Now
Analyst EGRAG CRYPTO has published a 13-part thread arguing that the XRP/BTC ratio follows a measurable liquidity cycle, and that current price structure is setting up for a repeat of the 2017 expansion.
What the XRP/BTC Ratio Actually Measures
Most traders watch XRP in dollar terms. That misses the point, according to EGRAG. The XRP/BTC ratio measures something different: whether capital is rotating from Bitcoin into XRP specifically. XRP can rise in dollar terms while still losing ground to Bitcoin. The ratio captures that distinction.
When the ratio rises, capital is leaving Bitcoin and entering XRP. Historically, those rotations have not been gradual. They have been violent and fast.
 Source: https://x.com/egragcrypto/status/2030251210364596439
The Two Zones That Define the Cycle
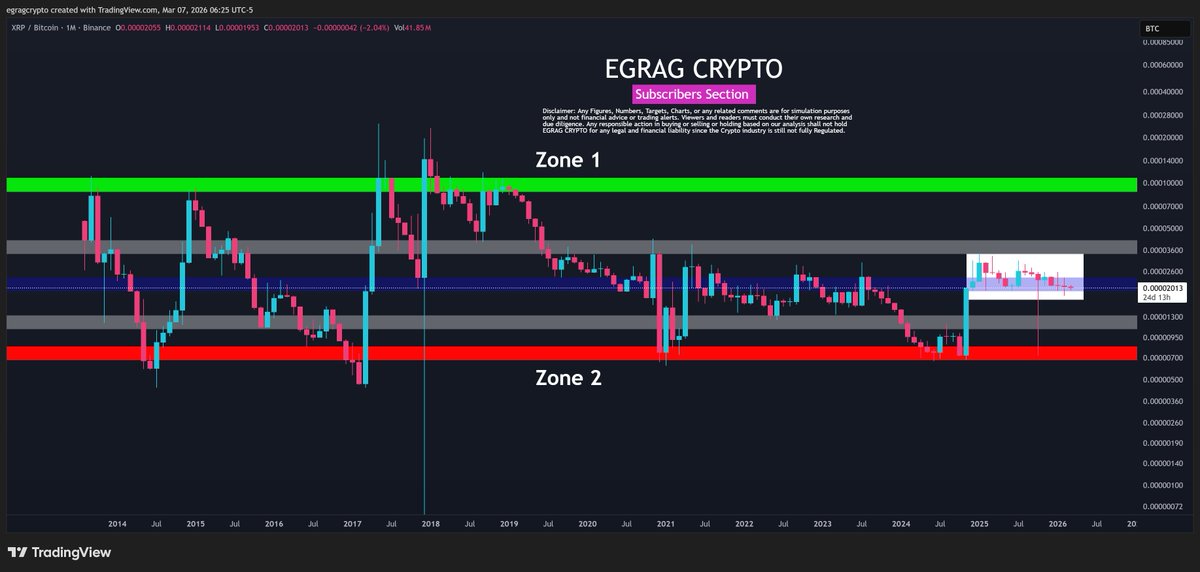
The monthly XRP/BTC chart on Binance, stretching from 2014 through early 2026, shows two structural zones that have defined every major cycle move.
Zone 1 sits at the top of the chart, marked in green. Every time the ratio has reached this area, XRP became overextended relative to Bitcoin, distribution followed, and a multi-year decline against BTC began. This occurred at the 2017 peak and again at the 2021 peak. Zone 1 is where cycles end.
Zone 2 sits at the bottom, marked in red. It is the capitulation zone. When the ratio touches this level, XRP becomes deeply undervalued against Bitcoin, long-term accumulation begins, and a relative outperformance phase follows. EGRAG identifies Zone 2 touches at the 2015 bottom, the 2020 bottom, and during the 2024 to 2025 sweep.
Current price is sitting inside a grey compression band between the two zones, shown as a white box on the right side of the chart.
How the Cycle Has Played Out Historically
EGRAG maps two complete cycles. The first ran from 2014 to 2017. After an early XRP spike, the ratio declined for years as capital drained back into Bitcoin dominance and market interest faded. Then 2017 arrived. The ratio broke out and XRP outperformed violently, not gradually.
The second cycle ran from 2018 through 2024. After the 2017 expansion, XRP/BTC collapsed again. Bitcoin dominance reasserted. XRP underperformed for years. The 2024 to 2025 period then swept Zone 2 again, completing the reset.
EGRAG argues the XRP/BTC ratio operates on an approximately eight-year liquidity cycle. Bitcoin dominance leads, altcoins get suppressed, liquidity resets, then altcoin expansion follows. XRP moves at the end of that sequence, not the beginning.
Where the Setup Sits Now
The current compression is the key detail. Price is moving sideways between the lower grey support band and the upper grey resistance band, which EGRAG describes as a classic accumulation range. Volatility has contracted. Liquidity is building.
The sequence he identifies after prior Zone 2 rebounds is consistent: sideways accumulation, a break above mid-range resistance, then violent outperformance against Bitcoin. That pattern preceded the 2017 explosion and appeared again before the 2021 relative rallies.
His projected sequence for 2025 to 2026 follows the same structure. Accumulation and compression first, then XRP begins outperforming Bitcoin, then the expansion phase begins. The signal to confirm it, he states, is a break above the upper grey resistance band on the XRP/BTC chart. That is when, historically, XRP/USD has rallied aggressively.
What the Analysis Does Not Resolve
Cycle repetition is a pattern, not a guarantee. The 2017 explosion followed years of underperformance and a Zone 2 touch. So did the 2021 rallies. The current setup matches both structurally. Whether it produces the same outcome depends on whether capital rotation actually materializes, and that requires broader market conditions the chart alone cannot predict.
The compression is real. The historical precedent exists. Neither confirms what comes next.
The post The XRP/BTC Ratio Has a Hidden Cycle And One Analyst Says It Is Repeating Right Now appeared first on ETHNews.
You May Also Like

Trump’s cyber strategy vows to ‘support the security’ of cryptocurrencies and blockchain

BlackRock’s Rapid Success: $260 Million from Bitcoin and Ethereum ETFs
