The post Altcoins May Have Bottomed as SEI Price Gears Up for a Massive Breakout—Key Levels to Watch appeared first on Coinpedia Fintech News The broader altcoinThe post Altcoins May Have Bottomed as SEI Price Gears Up for a Massive Breakout—Key Levels to Watch appeared first on Coinpedia Fintech News The broader altcoin

Altcoins May Have Bottomed as SEI Price Gears Up for a Massive Breakout—Key Levels to Watch

2026/03/06 22:01
3 min read
For feedback or concerns regarding this content, please contact us at [email protected]
SEI Price Strengthens as Institutional Validation and Stablecoin Growth Accelerate

The post Altcoins May Have Bottomed as SEI Price Gears Up for a Massive Breakout—Key Levels to Watch appeared first on Coinpedia Fintech News

The broader altcoin market could be approaching a pivotal moment. Recent crypto market structure suggests that altcoins, excluding the top 10 crypto have dropped to a critical support zone, a level that historically marks the end of prolonged corrective phases.

After weeks of sustained selling pressure across the crypto market, the total altcoin market cap excluding the top 10 assets appears to be stabilizing near a key accumulation region. This development is raising speculation that the altcoin sector may be preparing for its next breakout phase.

Amid this potential shift in sentiment, Sei price is emerging as one of the altcoins that could lead the next move.

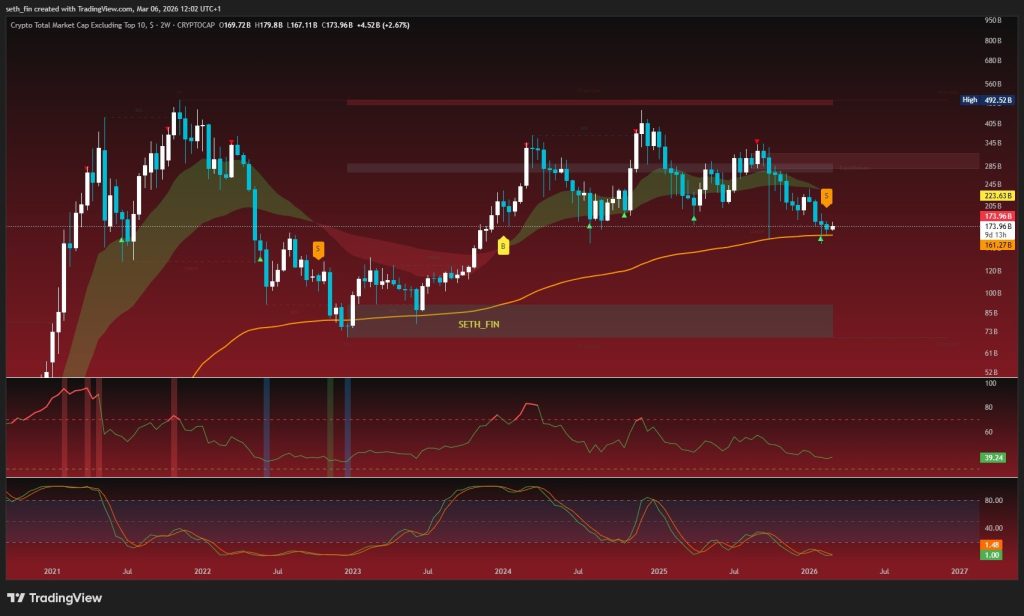
Altcoin Market Shows Signs of Bottom Formation

The chart tracking the crypto total market capitalization excluding the top 10 assets indicates that altcoins are currently holding near a major long-term support zone around $170 billion.

Historically, this region has acted as a strong demand area where buyers begin accumulating after extended market corrections. The latest price action shows that the market recently tested this support level and managed to stabilize, suggesting that selling pressure could be weakening.

sei priceSource: X

Momentum indicators further support this possibility. The Relative Strength Index (RSI) on the chart remains near the lower range, levels that have previously coincided with market bottoms in earlier cycles. Meanwhile, the stochastic momentum indicator is beginning to flatten, hinting that bearish momentum may be fading.

If the altcoin market manages to reclaim the $205 billion to $223 billion resistance zone, it could signal the beginning of a broader recovery across the altcoin sector.

SEI Price Testing a Critical Support Zone

Among the altcoins showing notable technical setups, Sei appears to be positioned at a key turning point. The weekly chart shows that SEI has been trading inside a descending channel, reflecting a prolonged corrective phase since its previous rally. Currently, the price is hovering near the lower boundary of this channel, around $0.065 to $0.07, which often acts as a strong support level in trending markets.

sei price

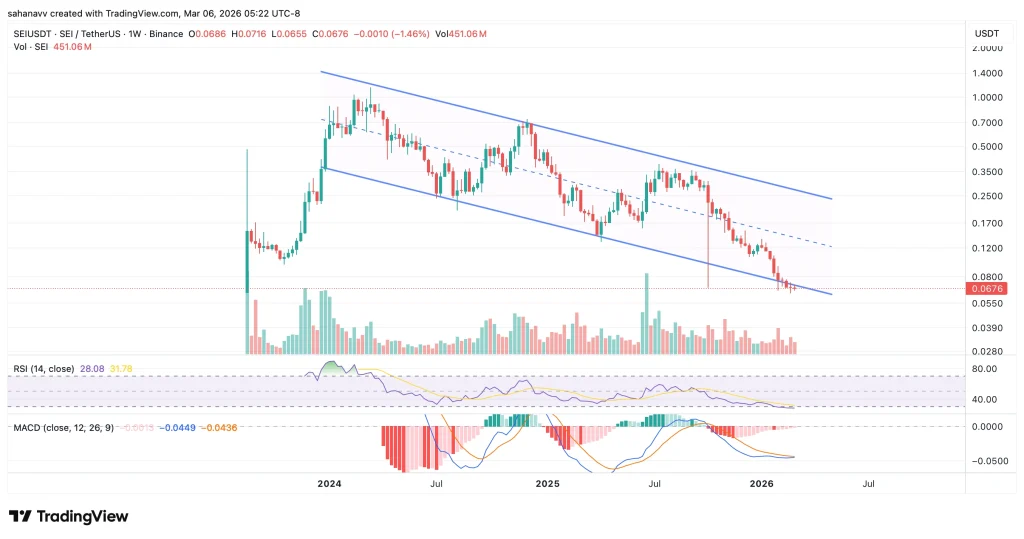
Momentum indicators are also beginning to signal that the selling pressure could be nearing exhaustion. The Relative Strength Index (RSI) on the weekly chart is currently hovering near 28, placing it close to oversold territory. Historically, similar RSI conditions have often preceded price recoveries. Meanwhile, the MACD indicator remains in negative territory but is beginning to flatten, as the levels are heading for a bullish crossover. 

What to Watch Next

The altcoin market appears to be approaching a critical turning point, with several indicators suggesting that the sector may be nearing the end of its correction phase. If the altcoin market cap excluding the top 10 cryptocurrencies begins to recover from its current support zone, it could trigger renewed momentum across the sector.

In such a scenario, Sei could emerge as one of the early movers and reach the resistance at $0.12, initially which may get extended to $0.18 and $0.25. On the downside, if itfails to hold the $0.06 support zone, the correction could extend further, delaying the potential breakout structure.

However, in the wider perspective, oversold indicators and a strengthening market structure suggest that the SEI price may be positioning itself at the foothill of a potential breakout if bullish sentiment returns to the altcoin market.

Market Opportunity
SEI Logo
SEI Price(SEI)
$0.0661
$0.0661$0.0661
-0.40%
USD
SEI (SEI) Live Price Chart
Disclaimer: The articles reposted on this site are sourced from public platforms and are provided for informational purposes only. They do not necessarily reflect the views of MEXC. All rights remain with the original authors. If you believe any content infringes on third-party rights, please contact [email protected] for removal. MEXC makes no guarantees regarding the accuracy, completeness, or timeliness of the content and is not responsible for any actions taken based on the information provided. The content does not constitute financial, legal, or other professional advice, nor should it be considered a recommendation or endorsement by MEXC.

You May Also Like

Bitcoin ETFs Surge with 20,685 BTC Inflows, Marking Strongest Week

Bitcoin ETFs Surge with 20,685 BTC Inflows, Marking Strongest Week

TLDR Bitcoin ETFs recorded their strongest weekly inflows since July, reaching 20,685 BTC. U.S. Bitcoin ETFs contributed nearly 97% of the total inflows last week. The surge in Bitcoin ETF inflows pushed holdings to a new high of 1.32 million BTC. Fidelity’s FBTC product accounted for 36% of the total inflows, marking an 18-month high. [...] The post Bitcoin ETFs Surge with 20,685 BTC Inflows, Marking Strongest Week appeared first on CoinCentral.
Share
Coincentral2025/09/18 02:30
Today’s NYT Pips Hints And Solutions For Thursday, September 18th

Today’s NYT Pips Hints And Solutions For Thursday, September 18th

The post Today’s NYT Pips Hints And Solutions For Thursday, September 18th appeared on BitcoinEthereumNews.com. It’s Thursday and I am incredibly sore and tired after really hitting the weights and the yoga mat hard this week. Sore is good! It takes pain to reduce pain, or at least that’s my experience with exercise. We must exercise our minds as well, and what better way to do that than with a fun puzzle game about placing dominoes in the correct tiles. Come along, my Pipsqueaks, let’s solve today’s Pips! Looking for Wednesday’s Pips? Read our guide right here. How To Play Pips In Pips, you have a grid of multicolored boxes. Each colored area represents a different “condition” that you have to achieve. You have a select number of dominoes that you have to spend filling in the grid. You must use every domino and achieve every condition properly to win. There are Easy, Medium and Difficult tiers. Here’s an example of a difficult tier Pips: Pips example Screenshot: Erik Kain As you can see, the grid has a bunch of symbols and numbers with each color. On the far left, the three purple squares must not equal one another (hence the equal sign crossed out). The two pink squares next to that must equal a total of 0. The zig-zagging blue squares all must equal one another. You click on dominoes to rotate them, and will need to since they have to be rotated to fit where they belong. Not shown on this grid are other conditions, such as “less than” or “greater than.” If there are multiple tiles with > or < signs, the total of those tiles must be greater or less than the listed number. It varies by grid. Blank spaces can have anything. The various possible conditions are: = All pips must equal one another in this group. ≠ All pips…
Share
BitcoinEthereumNews2025/09/18 08:59
Vitalik Buterin to Ethereum Developers: Build It Like It Has to Last Without You

Vitalik Buterin to Ethereum Developers: Build It Like It Has to Last Without You

Key Takeaways Vitalik Buterin wants Ethereum apps built to survive without developers, corporate servers, or trusted third parties Two major […] The post Vitalik
Share
Coindoo2026/03/07 15:49