

PYTH Network Price Prediction 2026, 2027 – 2030: Will PYTH Price Top $1?
The post PYTH Network Price Prediction 2026, 2027 – 2030: Will PYTH Price Top $1? appeared first on Coinpedia Fintech News
Story Highlights
- The live price of the PYTH Network is $ 0.06583211
- Price predictions for 2026 range from $0.80 to $0.60.
- Long term forecasts suggest PYTH price may hit $4.00 by the end of 2030.
PYTH Network is a decentralized oracle protocol that provides high-frequency financial market data to smart contracts.
Unlike traditional oracle models that rely on aggregated third-party sources, PYTH focuses on first-party data publishers, including market makers, exchanges, and trading firms.
Originally launched within the Solana ecosystem, PYTH has since expanded its reach across multiple blockchains, positioning itself as a potential backbone for advanced DeFi infrastructure.
Despite its strong technological foundation, PYTH’s token price has struggled to sustain upside momentum. Persistent selling pressure from scheduled token unlocks, coupled with weak mid-cap altcoin sentiment, has kept PYTH trading well below earlier market expectations.
This raises an important question for long-term investors: Can PYTH recover and hit $4 by 2030, or will tokenomics continue to suppress price growth?
Pyth Network Price Today
| Cryptocurrency | Pyth Network |
| Token | PYTH |
| Price | $0.0658 |
| Market Cap | $ 378,533,469.91 |
| 24h Volume | $ 19,626,208.8713 |
| Circulating Supply | 5,749,982,677.7476 |
| Total Supply | 9,999,982,677.7476 |
| All-Time High | $ 1.1501 on 16 March 2024 |
| All-Time Low | $ 0.0533 on 18 December 2025 |
PYTH Price Prediction January 2026
With the start of 2026, PYTH is showcasing a bounce from the demand zone of $0.05 and exited the consolidation range. However, momentum remains weak, but selling pressure has slowed, suggesting downside may be limited unless broader market sentiment turns sharply bearish.
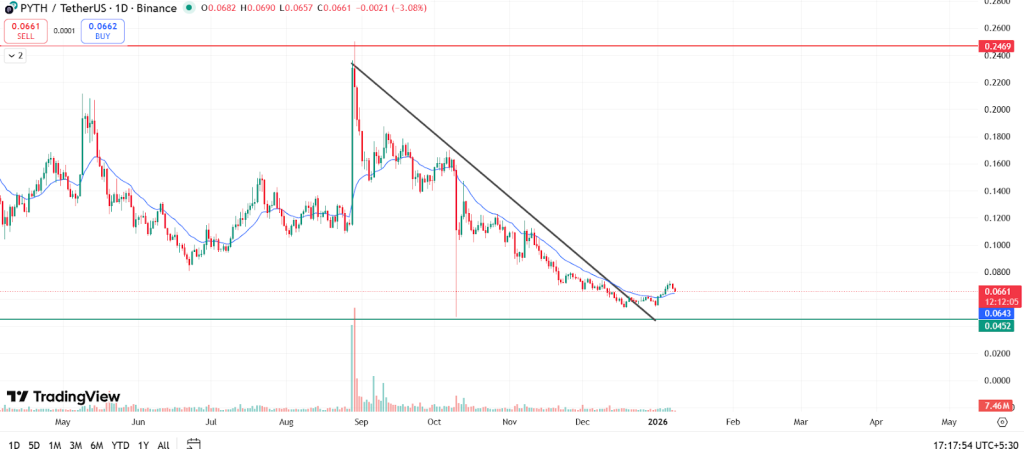
If buyers manage to defend current support levels, PYTH could attempt a minor relief bounce; however, any upside is likely to face resistance and remain capped.
Overall, the outlook for this month stays neutral to bullish, with range-bound price action dominating. In case of bounce, PYTH price may retest the upside of $0.10-$0.160 in the coming weeks.
How was PYTH Last 12 month’s Performance
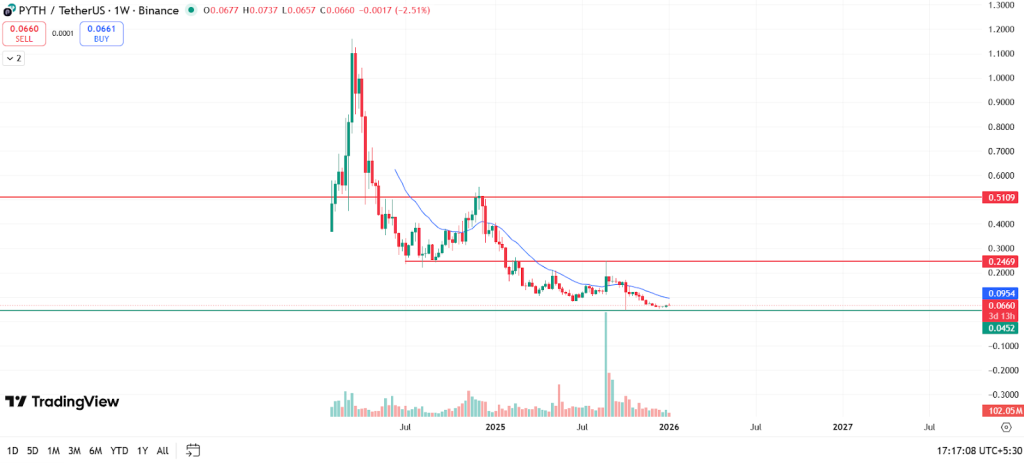
Over the past 12 months, PYTH has remained in a structurally bearish phase, marked by continued lower highs and lower lows on the weekly timeframe.
After witnessing an aggressive early rally that pushed price toward the $1.10–$1.20 region, PYTH faced strong distribution near this psychological and supply- zone. This marked the beginning of a prolonged correction cycle.
Following the top, the token entered a steep downtrend, slipping below key support levels around $0.51 followed by $0.24, both of which are clearly visible as major horizontal resistance zones on the chart.
Each relief rally into these levels was met with heavy selling, confirming strong overhead supply and a lack of sustained demand.
From a technical standpoint, PYTH price has consistently traded below its weekly moving average, which has acted as a dynamic resistance throughout the year 2025.

As PYTH approached the $0.06–$0.07 demand zone, price volatility compressed significantly.
The market transitioned into a low-momentum phase, characterized by small-doji candles and declining volume.
This indicates seller exhaustion, but not yet strong buyer conviction. However, no higher-low structure has formed so far, meaning the trend has not officially reversed.
PYTH Price Prediction 2026
Heading into 2026, PYTH’s technical outlook hinges on whether it can defend the current accumulation zone around $0.05–$0.07.
This zone represents a historically significant demand area where price compression, reduced volatility, and declining sell volume suggest that downside risk is gradually diminishing.
In a bullish scenario, PYTH may attempt a base-building phase during early 2026. If price manages to reclaim and sustain above the descending weekly moving average, it would mark the first meaningful trend shift in over a year.
Such a move could open the door for a gradual recovery toward the $0.40 resistance, which remains the most critical upside hurdle.
A successful breakout above this level would likely confirm a macro trend reversal and attract fresh momentum-driven participation.
However, any upside attempt is expected to be slow and structurally cautious, rather than explosive. PYTH could trade within a broad recovery range between $0.40 and $0.60 for much of 2026.
| Year | Potential Low ($) | Potential Average ($) | Potential High ($) |
| PYTH Price Prediction 2026 | 0.30 | 0.50 | 0.60 |
PYTH Price Onchain Outlook
PYTH’s price has remained subdued, but its on-chain activity continues to improve. Transaction growth and sustained oracle usage since 2024 indicate rising adoption across DeFi and cross-chain applications.
Despite weak price action, consistent contract interactions and developer engagement suggest a long-term accumulation phase, where network utility is expanding ahead of market valuation.
PYTH Network Price Analysis 2026 – 2030
| Year | Potential Low ($) | Potential Average ($ | Potential High ($) |
| 2026 | 0.30 | 0.50 | 0.60 |
| 2027 | 0.70 | 0.80 | 1.02 |
| 2028 | 0.86 | 1.03 | 1.30 |
| 2029 | 1.00 | 1.30 | 2.10 |
| 2030 | 1.70 | 2.30 | 4.00 |
PYTH Coin Price Prediction 2026
The PYTH price range in 2026 is expected to be between $0.30 and $0.60.
PYTH Network Price Action 2027
Subsequently, the PYTH price range can be between $0.700 to $1.02 during the year 2027.
PYTH Token Price Forecast 2028
The PYTH Network price for 2028 is anticipated to lie within the range of $0.860 to $1.30, with an average price of about $1.03.
PYTH Coin Price 2029
Thereafter, the PYTH price for the year 2029 could range between $1 and $2.10.
PYTH Network Price Prediction 2030
Finally, in 2030, the price of PYTH is predicted to maintain a steady positive. It may trade between $1.70 and $4.0.
PYTH Price Prediction 2031, 2032, 2033, 2040, 2050
Based on the historic market sentiments and trend analysis of the largest cryptocurrency by market capitalization, here are the possible PYTH price targets for the longer time frames.
| Year | Potential Low ($) | Potential Average ($) | Potential High ($) |
| 2031 | 3.20 | 5 | 7.20 |
| 2032 | 6.20 | 8 | 10 |
| 2033 | 8 | 10 | 12 |
| 2040 | 15 | 17 | 20 |
| 2050 | 30 | 33 | 50+ |
PYTH Price Prediction: What Does The Market Say?
| Year | 2026 | 2027 | 2030 |
| Changelly | $0.68 | $1.05 | $2.10 |
| CoinCodex | $0.55 | $0.85 | $1.45 |
| Binance | $0.72 | $1.10 | $1.85 |
CoinPedia’s PYTH Network Price Prediction
Coinpedia’s price prediction for PYTH is neutral to bullish as it was making a bottom and soon delivered a bounce. It may further showcase the bullish momentum and outperform in the next few months.
Rather than expecting sharp rallies, CoinPedia analysts expect PYTH to reflect progress gradually.
CoinPedia expects that PYTH Price to reach $0.60 by the year-end.
| Year | Potential Low ($) | Potential Average ($) | Potential High ($) |
| 2026 | 0.30 | 0.400-0.500 | 0.60 |
Never Miss a Beat in the Crypto World!
Stay ahead with breaking news, expert analysis, and real-time updates on the latest trends in Bitcoin, altcoins, DeFi, NFTs, and more.
FAQs
In 2026, PYTH is expected to trade between $0.30 and $0.60, with recovery depending on holding key support and improving market sentiment.
PYTH could reach $4 by 2030 if adoption accelerates, token unlock pressure eases, and a broader crypto bull cycle supports higher valuations.
PYTH may suit long-term investors who believe in oracle-driven DeFi growth, but price recovery is likely gradual rather than fast or explosive.
You May Also Like

Dramatic Spot Crypto ETF Outflows Rock US Market

Remittix Success Leads To Rewarding Presale Investors With 300% Bonus – Here’s How To Get Involved
