Gold Hits $5,170 as Trump’s 15% Tariff and Supreme Court Ruling Shake Markets
TLDR
- Gold rose toward $2,950/oz after Trump announced a 15% global tariff following a Supreme Court ruling against his emergency tariff powers
- The weaker dollar boosted gold’s appeal for international buyers
- Trade deals with the EU, India, and Japan are now uncertain after the court ruling
- US GDP grew just 1.4% in Q4, while inflation stayed above the Fed’s 2% target
- Silver rose 2.3% to $86.56/oz; other metals were mostly flat
Gold prices climbed for a fourth straight session on Monday as President Trump announced a new 15% global tariff, following a Supreme Court ruling that struck down his earlier emergency tariff powers.
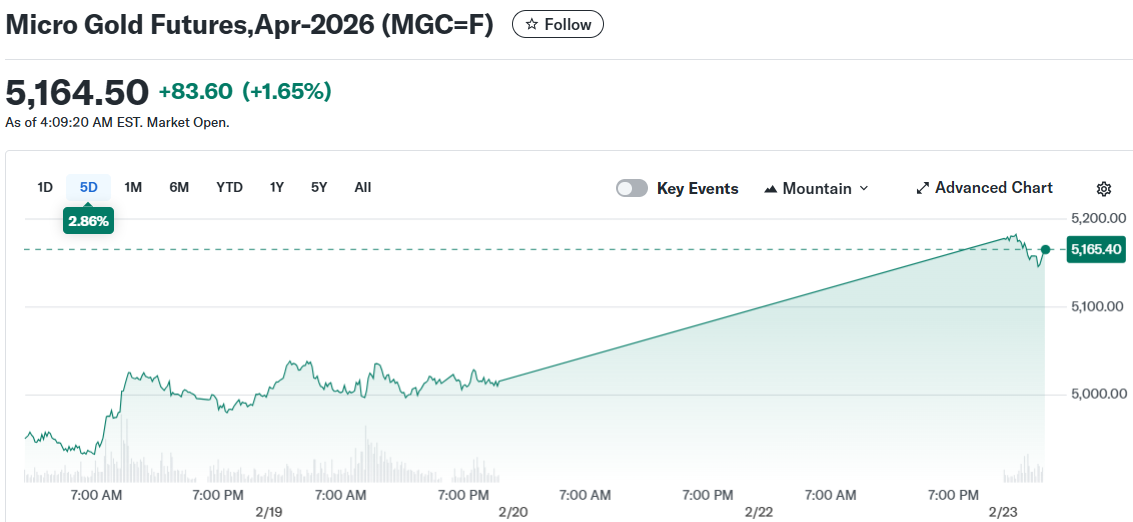 Micro Gold Futures,Apr-2026 (MGC=F)
Spot gold rose 0.8% to $5,148.66 an ounce. U.S. Gold Futures jumped 1.8% to $5,170.19.
Trump initially said he would impose a 10% tariff on global imports under Section 122 of U.S. trade law. He then raised it to 15%, the maximum allowed under the statute.
The Supreme Court had ruled against Trump’s use of emergency powers to set duties. That decision threw existing trade deals into question.
The EU’s trade chief said he would propose delaying ratification of a deal with Washington until there is more clarity. Indian officials postponed a planned trip to the U.S. A member of Japan’s ruling party called the situation “a real mess.”
How Tariff Uncertainty Is Driving Safe-Haven Demand
Investors moved toward gold and U.S. Treasuries as risk sentiment dropped. The uncertainty around how long the tariffs will last, and whether they face legal or congressional challenges, added to market volatility.
The dollar also weakened, making gold cheaper for buyers using other currencies. The Bloomberg Dollar Spot Index fell 0.2% on Monday after a similar drop on Friday.
Geopolitical tension between the U.S. and Iran also supported gold. The U.S. has built up a large military presence in the Middle East while talks over Iran’s nuclear program continue.
U.S. economic data added more pressure. GDP grew at just 1.4% annualized in Q4, a sharp slowdown. The Fed’s preferred inflation gauge, the PCE index, showed prices up 2.9% year-on-year in December, still above the 2% target.
What the Data Says About Gold’s Position
Hedge fund positioning in gold futures has fallen to its lowest level in nearly a year, according to CFTC data. Analysts say that leaves room for more buying, which could push prices higher.
Silver rose 2.3% to $86.56 per ounce. Platinum gained 0.3% to $2,164.60/oz. Copper was mostly flat.
Gold’s four-session winning streak follows a sharp selloff at the start of the month that had pulled prices down from a record high.
Vasu Menon, a strategist at Oversea-Chinese Banking Corp, said there are enough structural factors supporting gold in the medium term, but warned that short-term volatility is likely given still-unfolding U.S. trade policy and the Iran situation.
The most recent data shows spot gold trading at $5,134.16 as of Monday afternoon Singapore time.
The post Gold Hits $5,170 as Trump’s 15% Tariff and Supreme Court Ruling Shake Markets appeared first on CoinCentral.
You May Also Like
XRP stuck in range as descending channel caps upside momentum

Microsoft Corp. $MSFT blue box area offers a buying opportunity