

How AI Retrieves Anatomical Structures Using Vector Databases
Table of Links
Abstract and 1. Introduction
-
Materials and Methods
2.1 Vector Database and Indexing
2.2 Feature Extractors
2.3 Dataset and Pre-processing
2.4 Search and Retrieval
2.5 Re-ranking retrieval and evaluation
-
Evaluation and 3.1 Search and Retrieval
3.2 Re-ranking
-
Discussion
4.1 Dataset and 4.2 Re-ranking
4.3 Embeddings
4.4 Volume-based, Region-based and Localized Retrieval and 4.5 Localization-ratio
-
Conclusion, Acknowledgement, and References
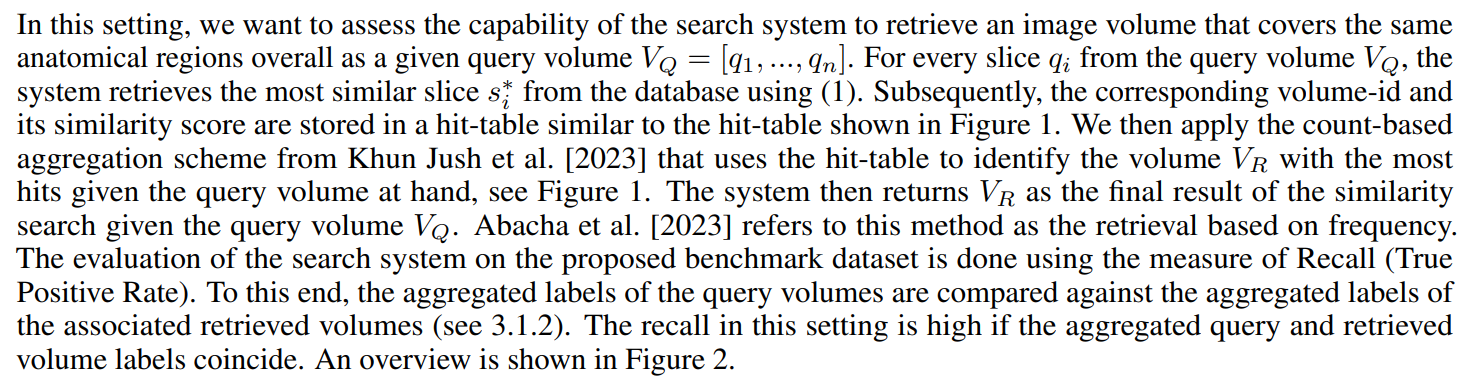
2.4 Search and Retrieval
After creating the vector database, the search is performed using the embeddings extracted from slices of query volumes. The simplest way of retrieval is to match a 2D query slice q with the most similar 2D slice in the database s ∗ by finding the slice-embedding that maximizes the cosine similarity with respect to the embedding associated with q, i.e.
\ 
\ where ⟨·, ·⟩ denotes standard scalar product, ∥·∥2 the euclidean norm, ϕ the embedding mapping and vs = ϕ(s)/∥ϕ(s)∥2 the pre-computed, normalized embedding associated to slice s stored in a vector index. In Khun Jush et al. [2023] the slice-wise retrieval was introduced as the lower bound baseline for evaluating the proposed aggregation and sampling schemes. Similarly, in this work, we keep the slice-wise evaluation as the lower bound for the retrieval rate of our methods. This method is the lower bound because for each slice only one slice is retrieved and for the perfect recall all the anatomical structures visible in the query slice should match the retrieved slice. In this baseline, each slice q of the query dataset is considered as an individual search instance. In addition, we performed and evaluated image retrieval in three additional scenarios:
\ 2.4.1 Volume-based retrieval and evaluation
\ 
\ 2.4.2 Region-based retrieval and evaluation
\ In this setting the search system is queried with an image (sub-)volume which is constrained to a specific anatomical sub-region (e.g. liver, pancreas, heart,…). For each anatomical region, we want to individually assess the capability of the system to retrieve an image volume containing the anatomical region.
\ The query (sub-)volumes for different anatomical regions are generated as follows. Given a selected anatomical region r and a query image volume VQ = [q1, …, qn], the smallest subset slices VQ,r = [qm, …, qk] ⊂ VQ is chosen that entirely
\ 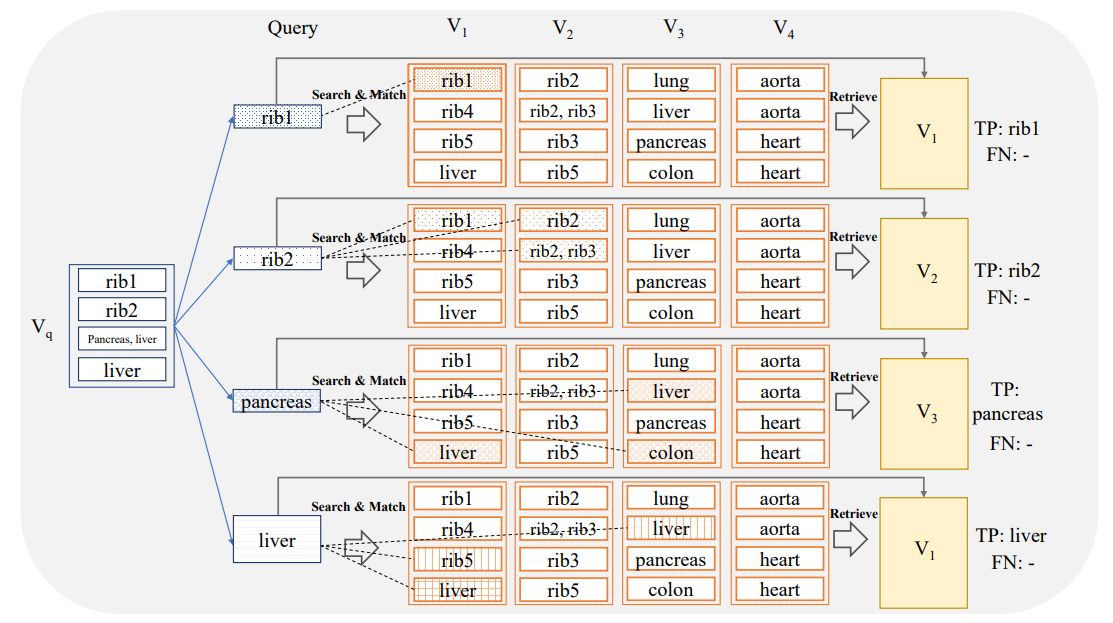
\ contains the anatomical region r visible in VQ. Based on the sub-volume VQ,r a similarity search is conducted to build up a hit-table, and the count-based aggregation is conducted to finally retrieve for this query the volume with most hits, as described in Section 2.4.1.
\ In this scenario, the evaluation is done for each anatomical region individually utilizing again the measure of Recall. To this end, for a selected anatomical region r the region-centric query sub-volumes are fed to the search system and the aggregated labels of the associated retrieved volumes are compared to r. The recall in this setting is high if the aggregated retrieved volume labels contain r. Hence, in this evaluation setting it is only required that the retrieved volume contains the anatomical region of interest. It is not required that the search system identifies the exact slices where the anatomical region is visible. The overview of this method is depicted in Figure 3. The question of whether the system can exactly localize anatomical regions will be addressed in Section 2.4.3. For example in Figure 3, V3 is retrieved for the r = ‘pancreas’ anatomical sub-region. During the evaluation, this instance is classified as a True Positive (TP) because the retrieved volume V3 contains ’pancreas’, regardless of whether the matched slices contained ’pancreas’.
\ 2.4.3 Localized retrieval and evaluation
\ In this setting, the system is queried with an image sub-volume which is constrained to a specific anatomical sub-region (e.g. liver, pancreas, heart,…). For each anatomical region, we want to individually assess the capability of the system to retrieve an image volume containing the anatomical region and to localize the region of interest within the retrieved volume.
\ The query sub-volumes VQ,r for different anatomical regions r are generated as described in detail in Section 2.4.2. Again, a similarity search is conducted based on the sub-volume VQ,r to retrieve the related volume VR,r with the most hits. In this scenario, the evaluation is done for each anatomical region individually utilizing again the measure of recall. The evaluation criterion is stricter than the region-based evaluation from Section 2.4.2. In order to be considered as a True Positive, at least one of the slices from VR,r that occurred in the similarity search must actually intersect with the region r. In other words, the search system is required to localize r in the sense that at least one slide is identified where r is visible. For example, for r = ‘pancreas’ if a search retrieves a volume that indeed includes the pancreas, but the specific slices hit in the similarity search do not insect the organ, the result is marked as False Negative (FN) in the evaluation, even though the pancreas is present elsewhere in the volume (see Figure 4). The capability for a search
\ 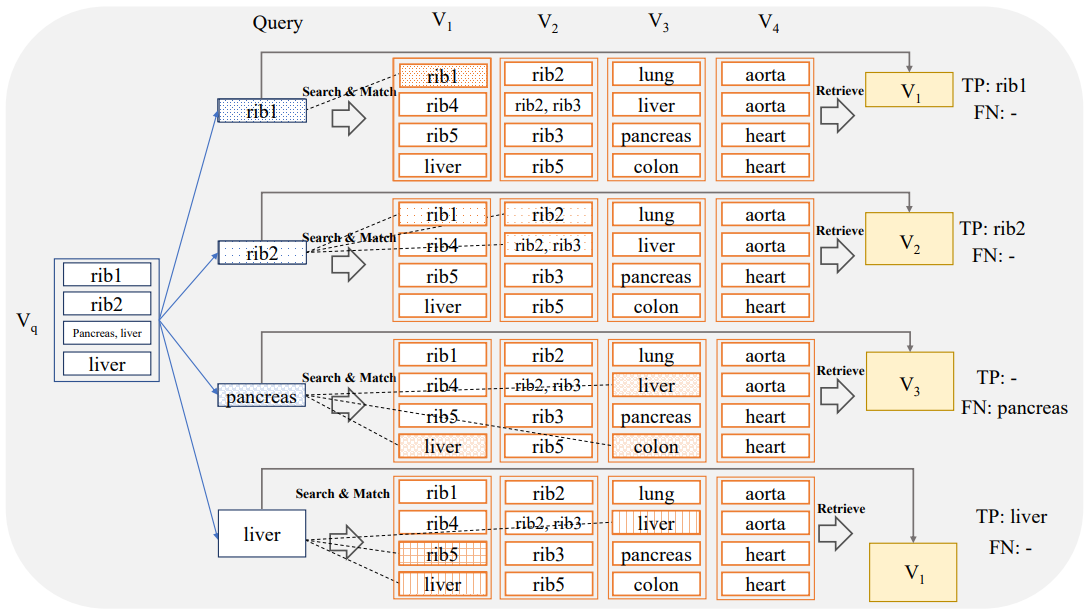
\ system to localize an anatomical subregion of interest within a retrieved volume is particularly useful for applications with user interaction, e.g. the user marks a subregion in an image and queries the search system to retrieve similar cases from a database and localizes the corresponding subregions therein.
\ Another measure to assess the capability of the system to localize a region can be defined as the ratio of the slices that actually contain the subregion r in the retrieved volume to the total number of slices hit in the retrieved volume. In detail, the localization-ratio (LR) is defined as:
\ 
\ For example, the query consists of 60 slices related to region r. The table representing the top 3 volumes hit count is [48, 21, 4]. In the volume with the top hit count, 12 out of the 48 hit slices actually contain region r, indicating successful localization. The localization-ratio is then given by 12/48 = .25.
\
:::info Authors:
(1) Farnaz Khun Jush, Bayer AG, Berlin, Germany ([email protected]);
(2) Steffen Vogler, Bayer AG, Berlin, Germany ([email protected]);
(3) Tuan Truong, Bayer AG, Berlin, Germany ([email protected]);
(4) Matthias Lenga, Bayer AG, Berlin, Germany ([email protected]).
:::
:::info This paper is available on arxiv under CC BY 4.0 DEED license.
:::
\

You May Also Like

Verimatrix: Sale of Extended Threat Defense Assets (Mobile Application Protection) to Guardsquare

IP Hits $11.75, HYPE Climbs to $55, BlockDAG Surpasses Both with $407M Presale Surge!
