PENGU Price Falls Below $0.011 as Manchester City Partnership Hype Fades
This article was first published on The Bit Journal.
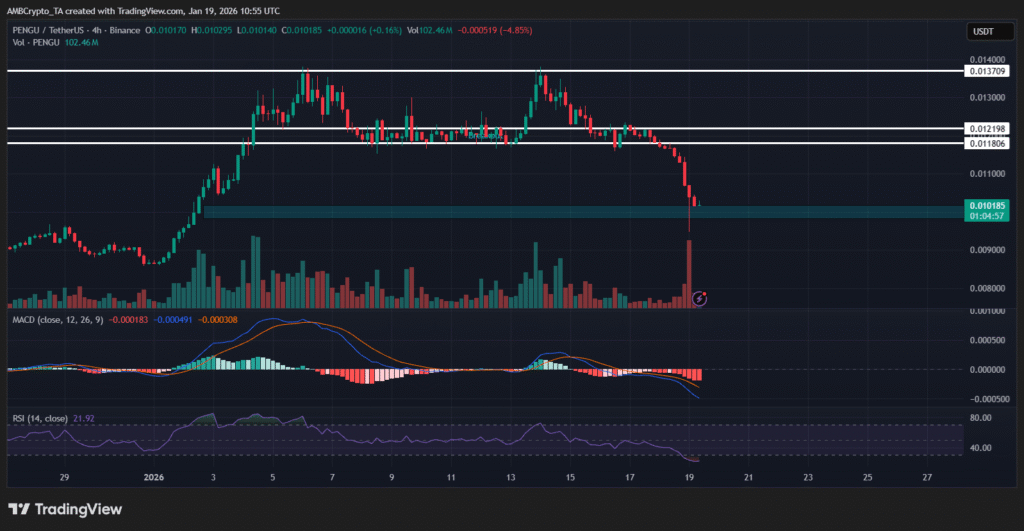
PENGU price opened in January near $0.009 and surged on speculative inflows, but the rally faded as profit-taking and leverage unwound pushed the token back toward key support zones.
The market saw early strength as buyers drove the price toward the $0.013 area on rising participation and expanding volume. That rally looked like a breakout fueled by short-term demand.
Because the volume profile aligned more with momentum chasing than steady accumulation. Once upside slowed, early participants started locking in gains and the flow turned from aggressive buying to controlled selling.
PENGU Slips Below $0.011 as Liquidity Thins
Sell pressure intensified after the token slipped below $0.011, which had acted as a near-term support line during the push higher. The break likely triggered a wave of stop-loss orders as liquidity thinned and sellers pressed their advantage.
The current structure reflects a market attempting to stabilize after a fast breakout and equally fast reversal. PENGU price now trades in a two-sided zone where sentiment, liquidity, and memecoin rotation will determine direction.
Also Read: Crypto Price Prediction Today: XRP, Cardano, PENGU Outlook
Traders are focused on whether buyers can defend $0.010 and rebuild volume, because that level has become the immediate pivot for market confidence.
At the same time, broader risk appetite remains important, since memecoins tend to amplify both optimism and fear. If the sector stays under pressure, rallies may keep getting sold quickly, and price action may remain range-bound rather than trend-driven.
Breakout Momentum Lifted PENGU Price Toward $0.013
PENGU price entered January with strong upside energy as speculative capital rotated back into high-beta tokens. The move from $0.009 toward $0.013 unfolded quickly, supported by expanding volume and rapid price progression.
While the rally looked decisive at first, it lacked extended follow-through after the initial push. That became the first warning sign that the move depended heavily on short-term participation. When buying cooled, the market became more vulnerable to profit-taking.
 Source: TradingView
Profit-Taking Replaced Speculative Inflows
As the token approached the $0.011–$0.012 region, selling began to appear more consistently. Traders who entered early used the rally as an exit window, especially as upside momentum slowed and the market stopped printing strong continuation candles.
Instead of panic dumping, the selling pattern resembled structured distribution, where participants gradually unload into strength. This dynamic typically creates choppy candles and repeated rejection wicks, which often precede breakdowns.
Support Failure at $0.011 Accelerated Declines
The $0.011 level became the most important short-term support because it acted as a midpoint for the breakout structure. Once price slipped beneath it, sell pressure grew faster and buyers became less aggressive.
| Month | Min. Price | Avg. Price | Max. Price | Change |
|---|---|---|---|---|
| Jan 2026 | $ 0.007005 | $ 0.007964 | $ 0.01004 |
0.14%
|
| Feb 2026 | $ 0.007609 | $ 0.007860 | $ 0.008142 |
-18.78%
|
| Mar 2026 | $ 0.007492 | $ 0.007773 | $ 0.008134 |
-18.86%
|
| Apr 2026 | $ 0.006890 | $ 0.007323 | $ 0.007691 |
-23.27%
|
| May 2026 | $ 0.007289 | $ 0.007469 | $ 0.007628 |
-23.91%
|
| Jun 2026 | $ 0.007548 | $ 0.007852 | $ 0.008223 |
-17.98%
|
| Jul 2026 | $ 0.007930 | $ 0.008061 | $ 0.008195 |
-18.25%
|
| Aug 2026 | $ 0.007886 | $ 0.008311 | $ 0.009374 |
-6.49%
|
| Sep 2026 | $ 0.009083 | $ 0.01079 | $ 0.01406 |
40.21%
|
| Oct 2026 | $ 0.01456 | $ 0.02223 | $ 0.02755 |
174.83%
|
| Nov 2026 | $ 0.01707 | $ 0.02006 | $ 0.02292 |
128.62%
|
| Dec 2026 | $ 0.02197 | $ 0.02273 | $ 0.02434 |
142.81%
|
PENGU price then faced thinner bids, which allowed the decline to extend without strong interruption. The next key level attracting attention is $0.010, which may decide whether the decline pauses or expands.
Technical Indicators Lean Bearish on Lower Timeframes
Momentum indicators also reflected weakness as the drop unfolded. MACD extended deeper into bearish territory, suggesting downside acceleration remained active.
Heavy red volume bars strengthened the bearish case because they often confirm active distribution rather than a simple dip. For stabilization, traders usually want to see selling volume fade, RSI recover from extreme readings, and prices begin forming higher lows.
Partnership Narrative Fueled Hype but Sparked “Sell-the-News”
Speculation also rose due to a reported partnership with Manchester City around January 15, which boosted expectations for brand exposure and wider cultural reach. However, the market appeared to realize that the impact would be gradual rather than immediate in token utility.
Once that longer timeline became clear, buying pressure weakened near the $0.011–$0.012 range and traders shifted into sell-the-news behavior. The move contributed to a 4–5% pullback and extended overall losses from the early-January highs.
 Source: X
Key Levels Define the Next Path
The bearish path becomes clearer if buyers fail to defend $0.010, because a breakdown could reopen the $0.0090–$0.0095 zone, which aligns with prior consolidation. This scenario fits an environment where memecoin liquidity stays thin and market sentiment remains defensive.
The bullish path requires regaining structure through key resistance. A reclaim of $0.0115 would be the first meaningful step, while a sustained move above $0.012 would signal that sell pressure has been absorbed.
Conclusion
PENGU price is at a significant juncture following its January advance devolved into distribution and some risk-off positioning. The market is currently focusing on the $0.010 support and a recovery zone at $0.011-$0.0115, before determining whether it breaks lower or holds for an upward move.
Also Read: PENGU Price Forecast: Will It Break $0.040 Resistance Level in Q4?
Appendix: Glossary of Key Terms
Support Level: A price zone where buying demand often prevents further decline.
Resistance Level: A price zone where selling pressure often blocks further gains.
Breakout: A move above resistance that signals potential trend continuation.
Distribution: Selling by early buyers while price still looks strong.
Sell-the-News: When traders exit after a bullish event becomes public.
Stop-Loss Cluster: A group of stop orders that trigger fast price drops when hit.
Liquidity: How easily an asset can be bought or sold without sharp moves.
Oversold: A condition where price drops too fast and may rebound short-term.
Frequently Asked Questions About Pengu Price
1- Why did PENGU price drop after the breakout?
The rally attracted short-term traders who took profits quickly, while weaker follow-through buying and leverage unwinds increased selling pressure.
2- What support level matters most right now?
The $0.010 area is the key level traders are watching, because a break below it could expose the $0.0090–$0.0095 zone.
3- What confirms a bullish recovery?
A strong reclaim above $0.0115 is a first signal, but a sustained move above $0.012 with rising volume would provide stronger confirmation.
4- Did the Manchester City partnership cause volatility?
It helped boost expectations, but once traders saw the benefits were gradual, sell-the-news pressure appeared near resistance.
Reference
AMBCrypto
Read More: PENGU Price Falls Below $0.011 as Manchester City Partnership Hype Fades">PENGU Price Falls Below $0.011 as Manchester City Partnership Hype Fades
You May Also Like

Bitcoin ETFs Surge with 20,685 BTC Inflows, Marking Strongest Week

UL Research Institutes’ Chemical Insights Scientist Receives Achievement Award from The Society of Toxicology