XRP’s falling wedge pattern signals potential breakout to $2.23. Key resistance at $2.05 could trigger XRP’s bullish rally. Technical indicators suggest XRP mightXRP’s falling wedge pattern signals potential breakout to $2.23. Key resistance at $2.05 could trigger XRP’s bullish rally. Technical indicators suggest XRP might

XRP Bullish Breakout Imminent? Falling Wedge Pattern Paints Clear Picture

  • XRP’s falling wedge pattern signals potential breakout to $2.23.
  • Key resistance at $2.05 could trigger XRP’s bullish rally.
  • Technical indicators suggest XRP might surge after breaking key resistance.

XRP is attracting significant attention from traders and analysts as a bullish breakout could be on the horizon. According to analyst Ali Martinez, XRP has formed a falling wedge pattern on its 4-hour chart, a formation that often signals a strong bullish reversal. The technical setup points to a potential price surge, with a target of $2.23, should XRP break through its immediate resistance at $2.05.


The falling wedge pattern is marked by converging trendlines, indicating a narrowing price range. This pattern often precedes a sharp breakout, making it an important indicator for those watching XRP’s price movement. Martinez specifically pointed out that a breakout above the $2.05 level could trigger a rally towards $2.23, setting the stage for an extended bullish move.


Also Read: MegaETH Set to Break Records with 11 Billion Transactions in Epic Stress Test!


Technical Indicators Back Up the Bullish Outlook

Despite a current price hovering around $1.95, XRP’s technical indicators suggest that a price reversal could be imminent. The Bollinger Bands are indicating that XRP is nearing the lower end of its trading range, which often signals an oversold condition and could pave the way for a rebound. Additionally, the Relative Strength Index (RSI) stands at 42.28, showing that XRP has room for upward movement without hitting overbought levels.
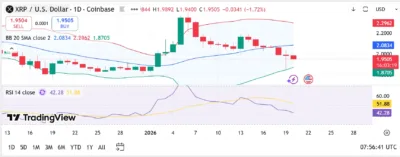

xrp

Source: Tradingview

The convergence of these technical factors, combined with the falling wedge pattern, adds weight to the analysis that XRP could be preparing for a breakout. Although the price remains below key moving averages, which generally signals bearish momentum, the falling wedge formation signals that a shift to the upside is increasingly likely if XRP can push above the $2.05 resistance.


Critical Resistance Level and Price Target

The $2.05 level remains crucial for XRP’s immediate upside potential, as a clear break above this resistance could open the door to a move toward $2.23, aligning with the upper trendline of the falling wedge. This price level represents a key point of resistance, and surpassing it would likely ignite a surge of buying activity, making the $2.23 target more attainable.


The price action is under close observation, with traders eagerly waiting to see how XRP behaves as it approaches these key levels. While the market sentiment remains cautious, the technical setup for XRP looks promising, offering the possibility of a bullish shift in the near future.


All eyes are on the $2.05 resistance level, and if XRP manages to break through it and sustain upward momentum, the price could rally toward $2.23, reaffirming the potential for a bullish breakout. Investors and traders will need to stay alert to market movements in the coming sessions to confirm whether the breakout theory holds.


Also Read: Crypto Market Update: Bitcoin, Ethereum, XRP, and Other Key Players Decline


The post XRP Bullish Breakout Imminent? Falling Wedge Pattern Paints Clear Picture appeared first on 36Crypto.

Market Opportunity
XRP Logo
XRP Price(XRP)
$1.9119
$1.9119$1.9119
-3.50%
USD
XRP (XRP) Live Price Chart
Disclaimer: The articles reposted on this site are sourced from public platforms and are provided for informational purposes only. They do not necessarily reflect the views of MEXC. All rights remain with the original authors. If you believe any content infringes on third-party rights, please contact [email protected] for removal. MEXC makes no guarantees regarding the accuracy, completeness, or timeliness of the content and is not responsible for any actions taken based on the information provided. The content does not constitute financial, legal, or other professional advice, nor should it be considered a recommendation or endorsement by MEXC.

You May Also Like

Robinhood’s New Move: MNT Coin Joins the Roster

Robinhood’s New Move: MNT Coin Joins the Roster

Bitcoin continues to hover beneath the $91,000 threshold, but the crypto domain isn’t stagnating. Cryptocurrency platforms are vigorously expanding their altcoin
Share
Coinstats2026/01/20 21:48
Microsoft Corp. $MSFT blue box area offers a buying opportunity

Microsoft Corp. $MSFT blue box area offers a buying opportunity

The post Microsoft Corp. $MSFT blue box area offers a buying opportunity appeared on BitcoinEthereumNews.com. In today’s article, we’ll examine the recent performance of Microsoft Corp. ($MSFT) through the lens of Elliott Wave Theory. We’ll review how the rally from the April 07, 2025 low unfolded as a 5-wave impulse followed by a 3-swing correction (ABC) and discuss our forecast for the next move. Let’s dive into the structure and expectations for this stock. Five wave impulse structure + ABC + WXY correction $MSFT 8H Elliott Wave chart 9.04.2025 In the 8-hour Elliott Wave count from Sep 04, 2025, we saw that $MSFT completed a 5-wave impulsive cycle at red III. As expected, this initial wave prompted a pullback. We anticipated this pullback to unfold in 3 swings and find buyers in the equal legs area between $497.02 and $471.06 This setup aligns with a typical Elliott Wave correction pattern (ABC), in which the market pauses briefly before resuming its primary trend. $MSFT 8H Elliott Wave chart 7.14.2025 The update, 10 days later, shows the stock finding support from the equal legs area as predicted allowing traders to get risk free. The stock is expected to bounce towards 525 – 532 before deciding if the bounce is a connector or the next leg higher. A break into new ATHs will confirm the latter and can see it trade higher towards 570 – 593 area. Until then, traders should get risk free and protect their capital in case of a WXY double correction. Conclusion In conclusion, our Elliott Wave analysis of Microsoft Corp. ($MSFT) suggested that it remains supported against April 07, 2025 lows and bounce from the blue box area. In the meantime, keep an eye out for any corrective pullbacks that may offer entry opportunities. By applying Elliott Wave Theory, traders can better anticipate the structure of upcoming moves and enhance risk management in volatile markets. Source: https://www.fxstreet.com/news/microsoft-corp-msft-blue-box-area-offers-a-buying-opportunity-202509171323
Share
BitcoinEthereumNews2025/09/18 03:50
Robinhood Crypto has listed the MNT token.

Robinhood Crypto has listed the MNT token.

PANews reported on January 20 that Robinhood announced on its X platform that the MNT token is now available for trading on Robinhood Crypto, including in the New
Share
PANews2026/01/20 22:02