Cardano price dropped to a crucial support level, continuing a downward trend that started in August when it was trading at $1.01500.Cardano price dropped to a crucial support level, continuing a downward trend that started in August when it was trading at $1.01500.

Cardano price forms bullish divergence as NIGHT token demand jumps

2025/12/17 23:34
3 min read

Cardano price dropped to a crucial support level, continuing a downward trend that started in August when it was trading at $1.01.

Summary
  • Cardano price dropped to a crucial support level.
  • The NIGHT token demand continues to grow, with its 4-hour volume reaching $1.7 billion.
  • Cardano is working on the Pentad proposal that will address key issues.

Cardano (ADA) token dropped to a low of $0.3836, bringing its market capitalization to $13.8 billion.

The token dropped despite having some important bullish catalysts, including the ongoing growth of Midnight (NIGHT), the recently launched security-focused network.

Data compiled by CMC shows that NIGHT is seeing strong demand from investors. Its 24-hour volume jumped by 23% to $1.69 billion, making it one of the most traded assets in the crypto industry. Its market capitalization has jumped to over $1.1 billion.

Cardano hopes that Midnight will become a major player in the security industry, where it will be able to handle sensitive data with a dual-state architecture. This means that it will separate public and private data, while still allowing controlled disclosures to auditors.

Cardano price has also dropped despite having some notable events, including the recently announced partnership with Pyth Network, the fifth biggest oracle network. 

This partnership means that it will now be possible for Cardano to attract developers as they now have access to quality off-chain data. 

Most importantly, the integration is part of a recently announced Pentad proposal that will see key organs in Cardano spend 70 million ADA tokens in 2026. 

In addition to adding quality oracle networks to Cardano, Pentad also hopes to  bring quality stablecoins, custody solutions, cross-chain bridges, and on-chain analytics projects onboard.

Cardano price technical analysis points to an eventual rebound 

cardano price

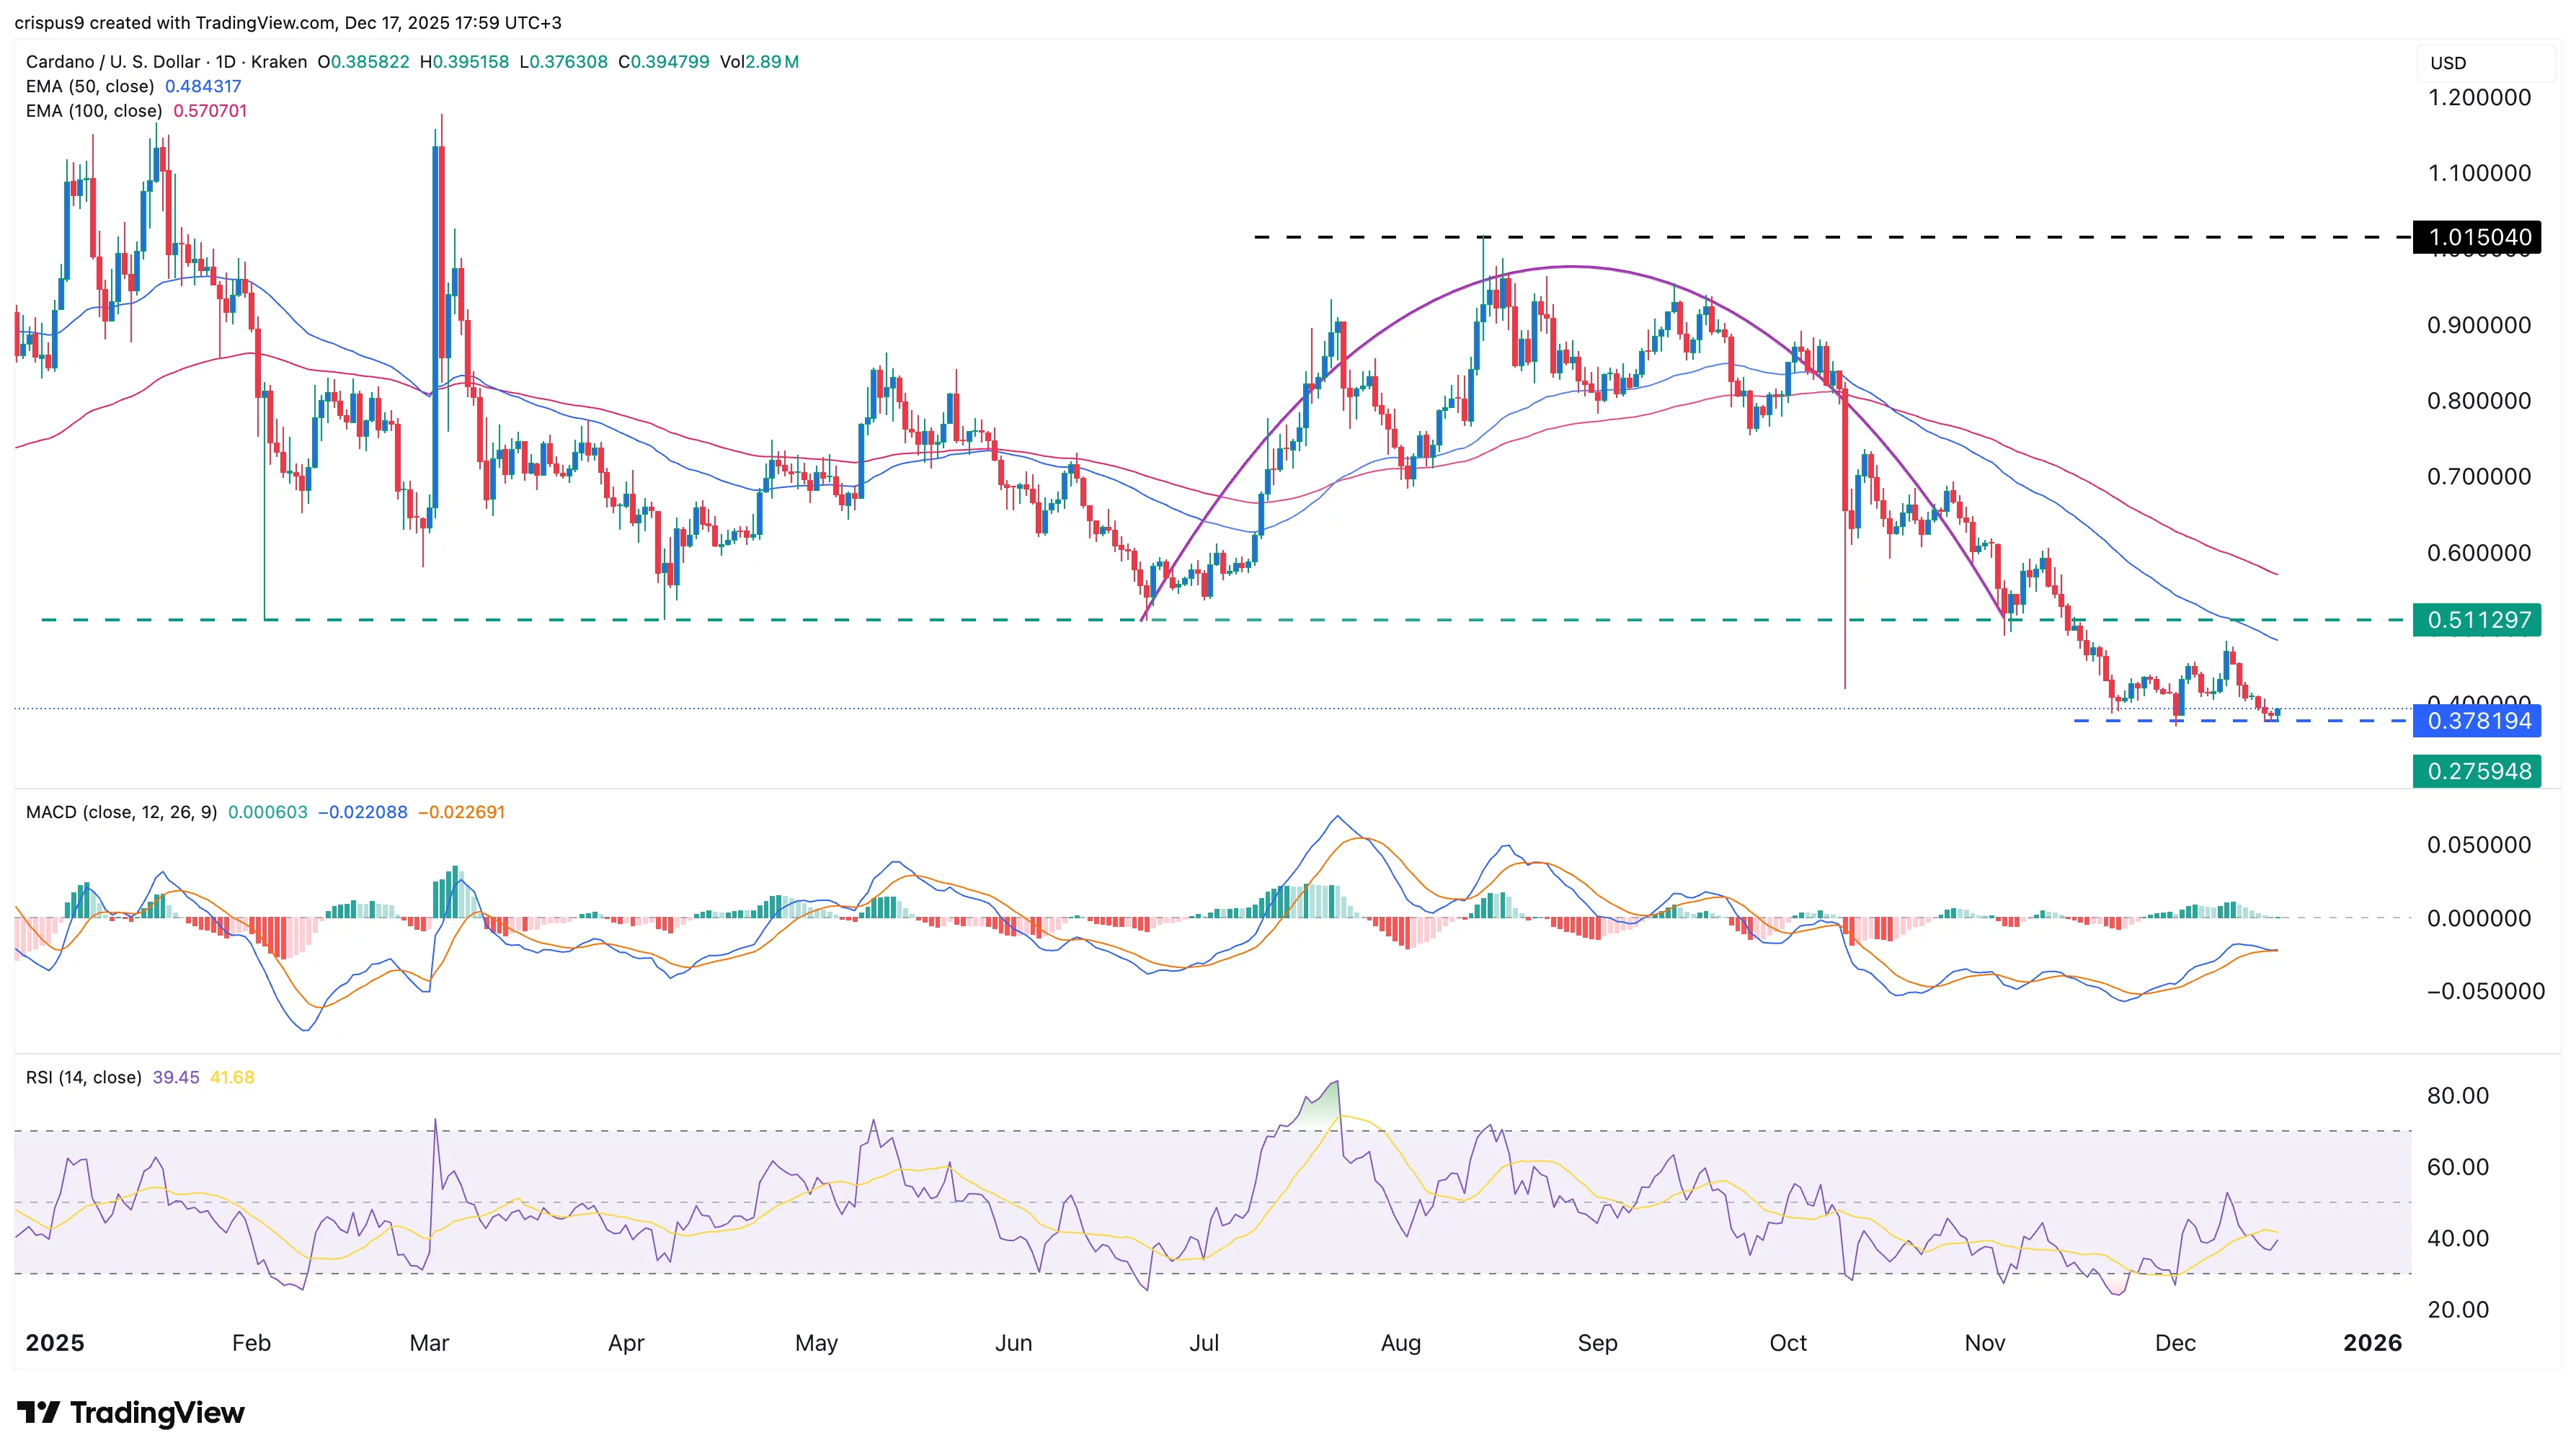
The daily timeframe chart shows that ADA price has been in a downward trend in the past few months, moving from the year-to-date high of $1.0150 in August to the current $0.40.

The token has already moved below the lower side of the inverted cup-and-handle pattern at $0.51130. It also remains below the 50-day and 100-day Exponential Moving Averages.

However, there are signs that the token has bottomed. It has formed a small double-bottom pattern at $0.3780 and a neckline at $0.4800. A double-bottom is one of the most common bullish reversal signs in technical analysis.

Also, the token has formed a bullish divergence pattern as the MACD and the Relative Strength Index have continued moving upwards. Therefore, a rebound may see the token rally to the key resistance level at $0.50. A drop below that support will point to more downside.

Market Opportunity
Bullish Degen Logo
Bullish Degen Price(BULLISH)
$0.009312
$0.009312$0.009312
-4.28%
USD
Bullish Degen (BULLISH) Live Price Chart
Disclaimer: The articles reposted on this site are sourced from public platforms and are provided for informational purposes only. They do not necessarily reflect the views of MEXC. All rights remain with the original authors. If you believe any content infringes on third-party rights, please contact [email protected] for removal. MEXC makes no guarantees regarding the accuracy, completeness, or timeliness of the content and is not responsible for any actions taken based on the information provided. The content does not constitute financial, legal, or other professional advice, nor should it be considered a recommendation or endorsement by MEXC.

You May Also Like

Pi Network Targets Open Mainnet 2026, Millions Prepare as Utility and Migration Accelerate

Pi Network Targets Open Mainnet 2026, Millions Prepare as Utility and Migration Accelerate

The Pi Network community is once again buzzing with renewed optimism following a powerful message circulating on social media regarding the project’s roadmap t
Share
Hokanews2026/02/07 20:41
Bitcoin Rainbow chart predicts BTC price for October 1, 2025

Bitcoin Rainbow chart predicts BTC price for October 1, 2025

The post Bitcoin Rainbow chart predicts BTC price for October 1, 2025 appeared on BitcoinEthereumNews.com. The Bitcoin (BTC) Rainbow Chart has outlined potential price ranges for October 1, 2025, as the asset seeks to reclaim the $120,000 resistance. Throughout September, the maiden cryptocurrency has struggled to push past the $115,000 support zone. At press time, Bitcoin was trading at $115,950, up 0.15% in the past 24 hours and gaining a modest 0.5% over the past week. Bitcoin seven-day price chart. Source: Finbold Looking ahead to October 1, the Rainbow Chart projects that Bitcoin’s price could fall within a broad band of $36,628 to $409,726, depending on prevailing market sentiment. The Rainbow Chart, a long-term valuation model often used to track Bitcoin’s price cycles, is built as a logarithmic regression chart. It color-codes Bitcoin’s valuation bands, offering investors a simplified way to gauge whether the market is undervalued or overheated. Bitcoin price prediction  The lowest tier, labeled “Basically a Fire Sale,” spans from $36,628 to $47,947. Above that, the “BUY!” zone ranges from $47,947 to $64,777, while “Accumulate” covers $64,777 to $83,811. The “Still Cheap” band sets Bitcoin between $83,811 and $108,471, followed by the neutral “HODL!” zone at $108,471 to $142,332. Bitcoin Rainbow chart. Source: BlockhainCenter Cautionary levels emerge as prices climb higher. In this case, the “Is this a bubble?” range extends from $142,332 to $181,644, while “FOMO intensifies” lies between $181,644 and $233,215. On the other hand, the red zones, seen as overheated territory, start with “Sell. Seriously, SELL!” at $233,215 to $304,169 and peak with “Maximum Bubble Territory” from $304,169 to $409,726. With Bitcoin trading around $116,000 as of September 20, the Rainbow Chart suggests that by October 1, 2025, the asset will most likely fall within the “Still Cheap” or “HODL!” bands, implying a fair value between $83,811 and $142,332. This outlook indicates that despite Bitcoin’s strong gains, the model places…
Share
BitcoinEthereumNews2025/09/21 01:51
White House Schedules Tuesday Stablecoin Talks as Banks Enter the Room

White House Schedules Tuesday Stablecoin Talks as Banks Enter the Room

The White House will host crypto firms and banks on February 10 to continue talks on stablecoin rules and advance the crypto market bill. The White House has set
Share
LiveBitcoinNews2026/02/07 19:45