Ethereum price is struggling to reclaim the $3,000 level as sustained exchange-traded fund outflows and weakening derivatives activity reinforce a risk-off marketEthereum price is struggling to reclaim the $3,000 level as sustained exchange-traded fund outflows and weakening derivatives activity reinforce a risk-off market

Ethereum price stalls below $3K as spot ETH ETFs see 4th straight day of net outflows

Ethereum price is struggling to reclaim the $3,000 level as sustained exchange-traded fund outflows and weakening derivatives activity reinforce a risk-off market backdrop.

Summary
  • Ethereum trades below $3,000 amid falling volume and declining derivatives participation.
  • Spot ETH ETFs posted $224M in daily outflows, led by BlackRock’s ETHA.
  • Bearish technical structure keeps downside risk elevated unless key resistance breaks.

Ethereum was trading at $2,919 at press time, down 0.5% over the past 24 hours. The second-largest cryptocurrency has slid 12% over the past week and is now trading about 41% below its August all-time high of $4,946.

At the same time, trading activity has cooled noticeably. Daily volume fell to $22.3 billion, down 27% from the prior session, suggesting fewer traders are stepping in as prices continue to stall beneath a key resistance level.

Derivatives data shows traders cutting exposure. According to CoinGlass data, ETH derivatives volume fell 31% to $58 billion, while open interest declined 2.2% to $36.87 billion. Together, these moves indicate that positions are being unwound rather than new leverage being added, a dynamic commonly observed during market pullbacks.

ETH ETF outflows extend to fourth straight day

Pressure on Ethereum (ETH) price has been compounded by continued outflows from U.S. spot ETH ETFs. Data from SoSoValue shows that ETH ETFs recorded net outflows of $224.26 million on Dec. 16, marking the fourth consecutive day of withdrawals.

BlackRock’s ETHA led the exodus, with $221 million exiting the fund, while Fidelity’s FETH saw a smaller $2.94 million outflow. Weekly ETH ETF outflows have now reached $449 million.

On the same day, investors pulled $277 million from Bitcoin ETFs. That move lifted total outflows across BTC and ETH funds to over $500 million, the biggest single-day withdrawal seen in nearly two weeks.

Market sentiment is still weighed down by macro uncertainty and overall weakness, and institutions appear to be taking a more cautious approach by scaling back their exposure. While 2025 has been a strong year for crypto-focused institutional products, recent trends show that this momentum is slowing.

Data shows that in Q4 2025 alone, Ethereum ETFs experienced net outflows of roughly $1.8 billion, reversing much of the previous inflow strength.

Ethereum price technical analysis

Ethereum is still trading in a clear medium-term downtrend, with prices making lower highs and lower lows. Every bounce so far has been capped below the previous swing highs.

On the daily chart, ETH has been hugging the lower Bollinger Band, which usually signals the trend is continuing rather than reversing. The 20-day simple moving average, the middle line of the Bollinger Bands, has repeatedly acted as resistance, stopping recent rebound attempts.

Ethereum price stalls below $3K as spot ETH ETFs see 4th straight day of net outflows - 1

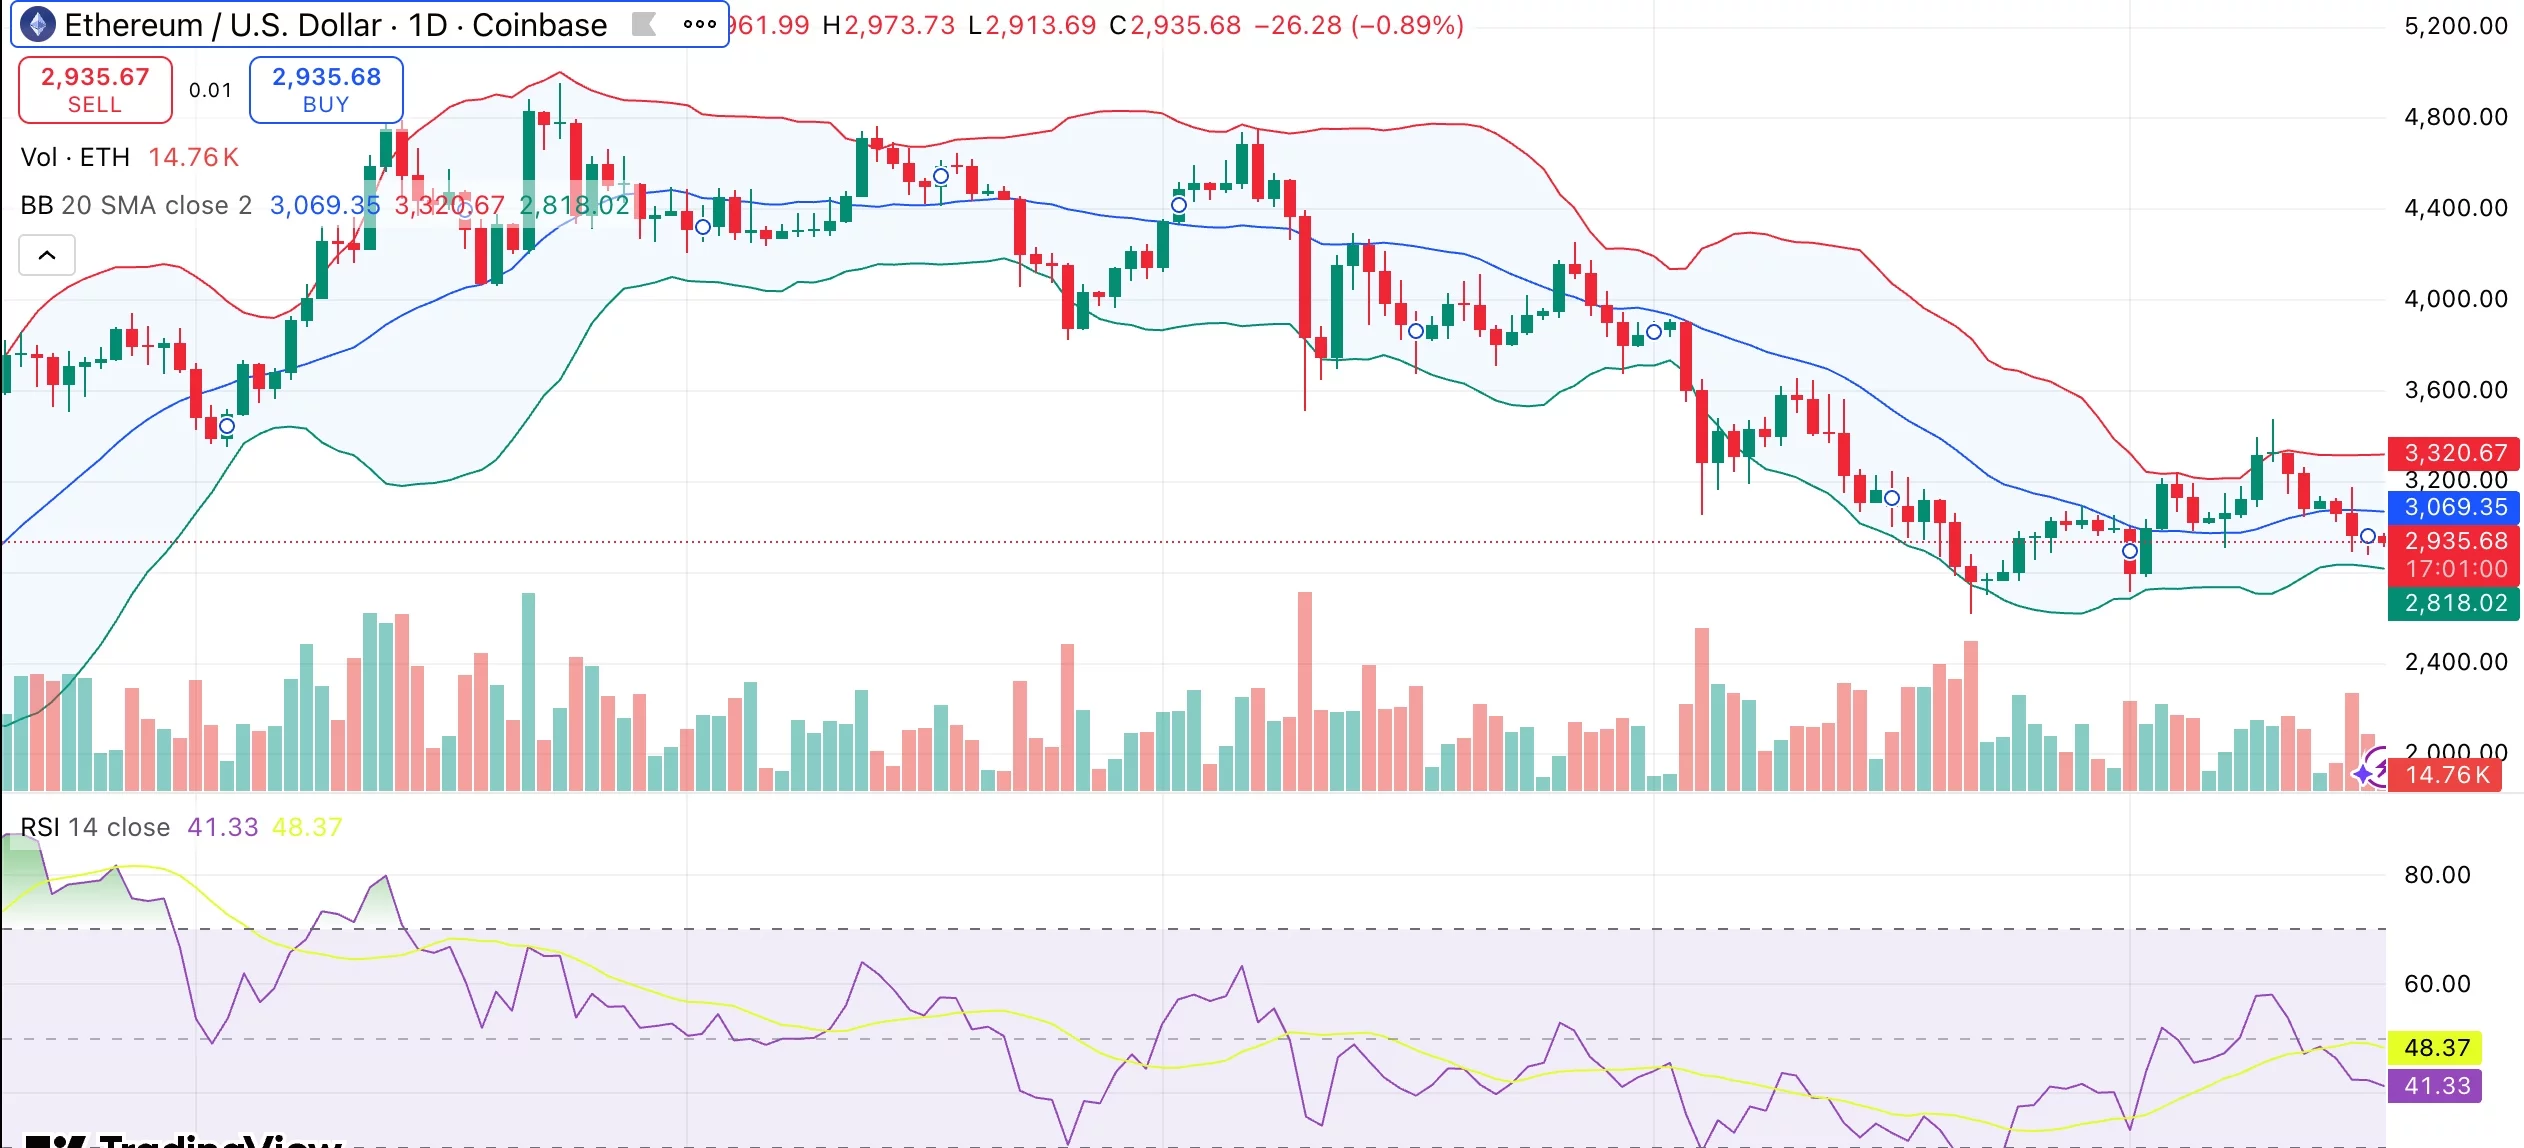
The Bollinger Bands are moderately wide, showing that volatility is still moving in one direction. This makes a sudden move higher unlikely without a strong new catalyst.

Momentum is still skewed in favor of sellers. The market is still in bearish territory as the 14-day RSI is close to 41, below the neutral 50 mark. There hasn’t been any obvious bullish signal or divergence between the relative strength index and the recent price lows.

Other tools, including the MACD, momentum indicators, and several moving averages, are all showing bearish signals.

For Ethereum to show signs of a short-term recovery, it would need to break back above the $3,060–$3,100 range and stay there. If it fails to hold $2,900, the downside could remain in focus, with $2,800 serving as the next important support level.

Market Opportunity
Ethereum Logo
Ethereum Price(ETH)
$2,901.44
$2,901.44$2,901.44
-0.11%
USD
Ethereum (ETH) Live Price Chart
Disclaimer: The articles reposted on this site are sourced from public platforms and are provided for informational purposes only. They do not necessarily reflect the views of MEXC. All rights remain with the original authors. If you believe any content infringes on third-party rights, please contact [email protected] for removal. MEXC makes no guarantees regarding the accuracy, completeness, or timeliness of the content and is not responsible for any actions taken based on the information provided. The content does not constitute financial, legal, or other professional advice, nor should it be considered a recommendation or endorsement by MEXC.

You May Also Like

Egrag Crypto: XRP Could be Around $6 or $7 by Mid-November Based on this Analysis

Egrag Crypto: XRP Could be Around $6 or $7 by Mid-November Based on this Analysis

Egrag Crypto forecasts XRP reaching $6 to $7 by November. Fractal pattern analysis suggests a significant XRP price surge soon. XRP poised for potential growth based on historical price patterns. The cryptocurrency community is abuzz after renowned analyst Egrag Crypto shared an analysis suggesting that XRP could reach $6 to $7 by mid-November. This prediction is based on the study of a fractal pattern observed in XRP’s past price movements, which the analyst believes is likely to repeat itself in the coming months. According to Egrag Crypto, the analysis hinges on fractal patterns, which are used in technical analysis to identify recurring market behavior. Using the past price charts of XRP, the expert has found a certain fractal that looks similar to the existing market structure. The trend indicates that XRP will soon experience a great increase in price, and the asset will probably reach the $6 or $7 range in mid-November. The chart shared by Egrag Crypto points to a rising trend line with several Fibonacci levels pointing to key support and resistance zones. This technical structure, along with the fractal pattern, is the foundation of the price forecast. As XRP continues to follow the predicted trajectory, the analyst sees a strong possibility of it reaching new highs, especially if the fractal behaves as expected. Also Read: Why XRP Price Remains Stagnant Despite Fed Rate Cut #XRP – A Potential Similar Set-Up! I've been analyzing the yellow fractal from a previous setup and trying to fit it into various formations. Based on the fractal formation analysis, it suggests that by mid-November, #XRP could be around $6 to $7! Fractals can indeed be… pic.twitter.com/HmIlK77Lrr — EGRAG CRYPTO (@egragcrypto) September 18, 2025 Fractal Analysis: The Key to XRP’s Potential Surge Fractals are a popular tool for market analysis, as they can reveal trends and potential price movements by identifying patterns in historical data. Egrag Crypto’s focus on a yellow fractal pattern in XRP’s price charts is central to the current forecast. Having contrasted the market scenario at the current period and how it was at an earlier time, the analyst has indicated that XRP might revert to the same price scenario that occurred at a later cycle in the past. Egrag Crypto’s forecast of $6 to $7 is based not just on the fractal pattern but also on broader market trends and technical indicators. The Fibonacci retracements and extensions will also give more insight into the price levels that are likely to be experienced in the coming few weeks. With mid-November in sight, XRP investors and traders will be keeping a close eye on the market to see if Egrag Crypto’s analysis is true. If the price targets are reached, XRP could experience one of its most significant rallies in recent history. Also Read: Top Investor Issues Advance Warning to XRP Holders – Beware of this Risk The post Egrag Crypto: XRP Could be Around $6 or $7 by Mid-November Based on this Analysis appeared first on 36Crypto.
Share
Coinstats2025/09/18 18:36
Moto completes $1.8 million pre-seed funding round for its Solana eco-credit card project.

Moto completes $1.8 million pre-seed funding round for its Solana eco-credit card project.

PANews reported on December 17th that Moto, an on-chain credit card project, announced the completion of a $1.8 million Pre-Seed funding round, led by Eterna Capital
Share
PANews2025/12/17 22:15
Why Investors Choose Pepeto As 2025’s Best Crypto: The Next Bitcoin Story

Why Investors Choose Pepeto As 2025’s Best Crypto: The Next Bitcoin Story

Desks still pass that story around because it’s proof that one coin can change everything. And the question that always […] The post Why Investors Choose Pepeto As 2025’s Best Crypto: The Next Bitcoin Story appeared first on Coindoo.
Share
Coindoo2025/09/18 04:39