

Will Solana’s Price Trajectory Be Defined By Losses?
Solana is in a critical phase as its recent decline continues to validate a channel pattern that has shaped its price action over the past week.
The downward movement highlights growing uncertainty, with investors now playing a key role in determining whether SOL continues slipping or finds support for a reversal.
Solana Investors Remain Bearish
The exchange net position change reflects conflicting signals from Solana holders. Throughout the past week, SOL wallets have oscillated between accumulation and distribution, creating an unstable backdrop.
Notably, the last 48 hours recorded a dominance of green bars, indicating heavier outflows from exchanges.
Such inconsistent behavior points to uncertainty among holders rather than strong conviction. The repeated switches between buying and selling reflect a market struggling to find direction.
With selling currently outweighing accumulation, Solana’s short-term outlook remains vulnerable.
Want more token insights like this? Sign up for Editor Harsh Notariya’s Daily Crypto Newsletter here.
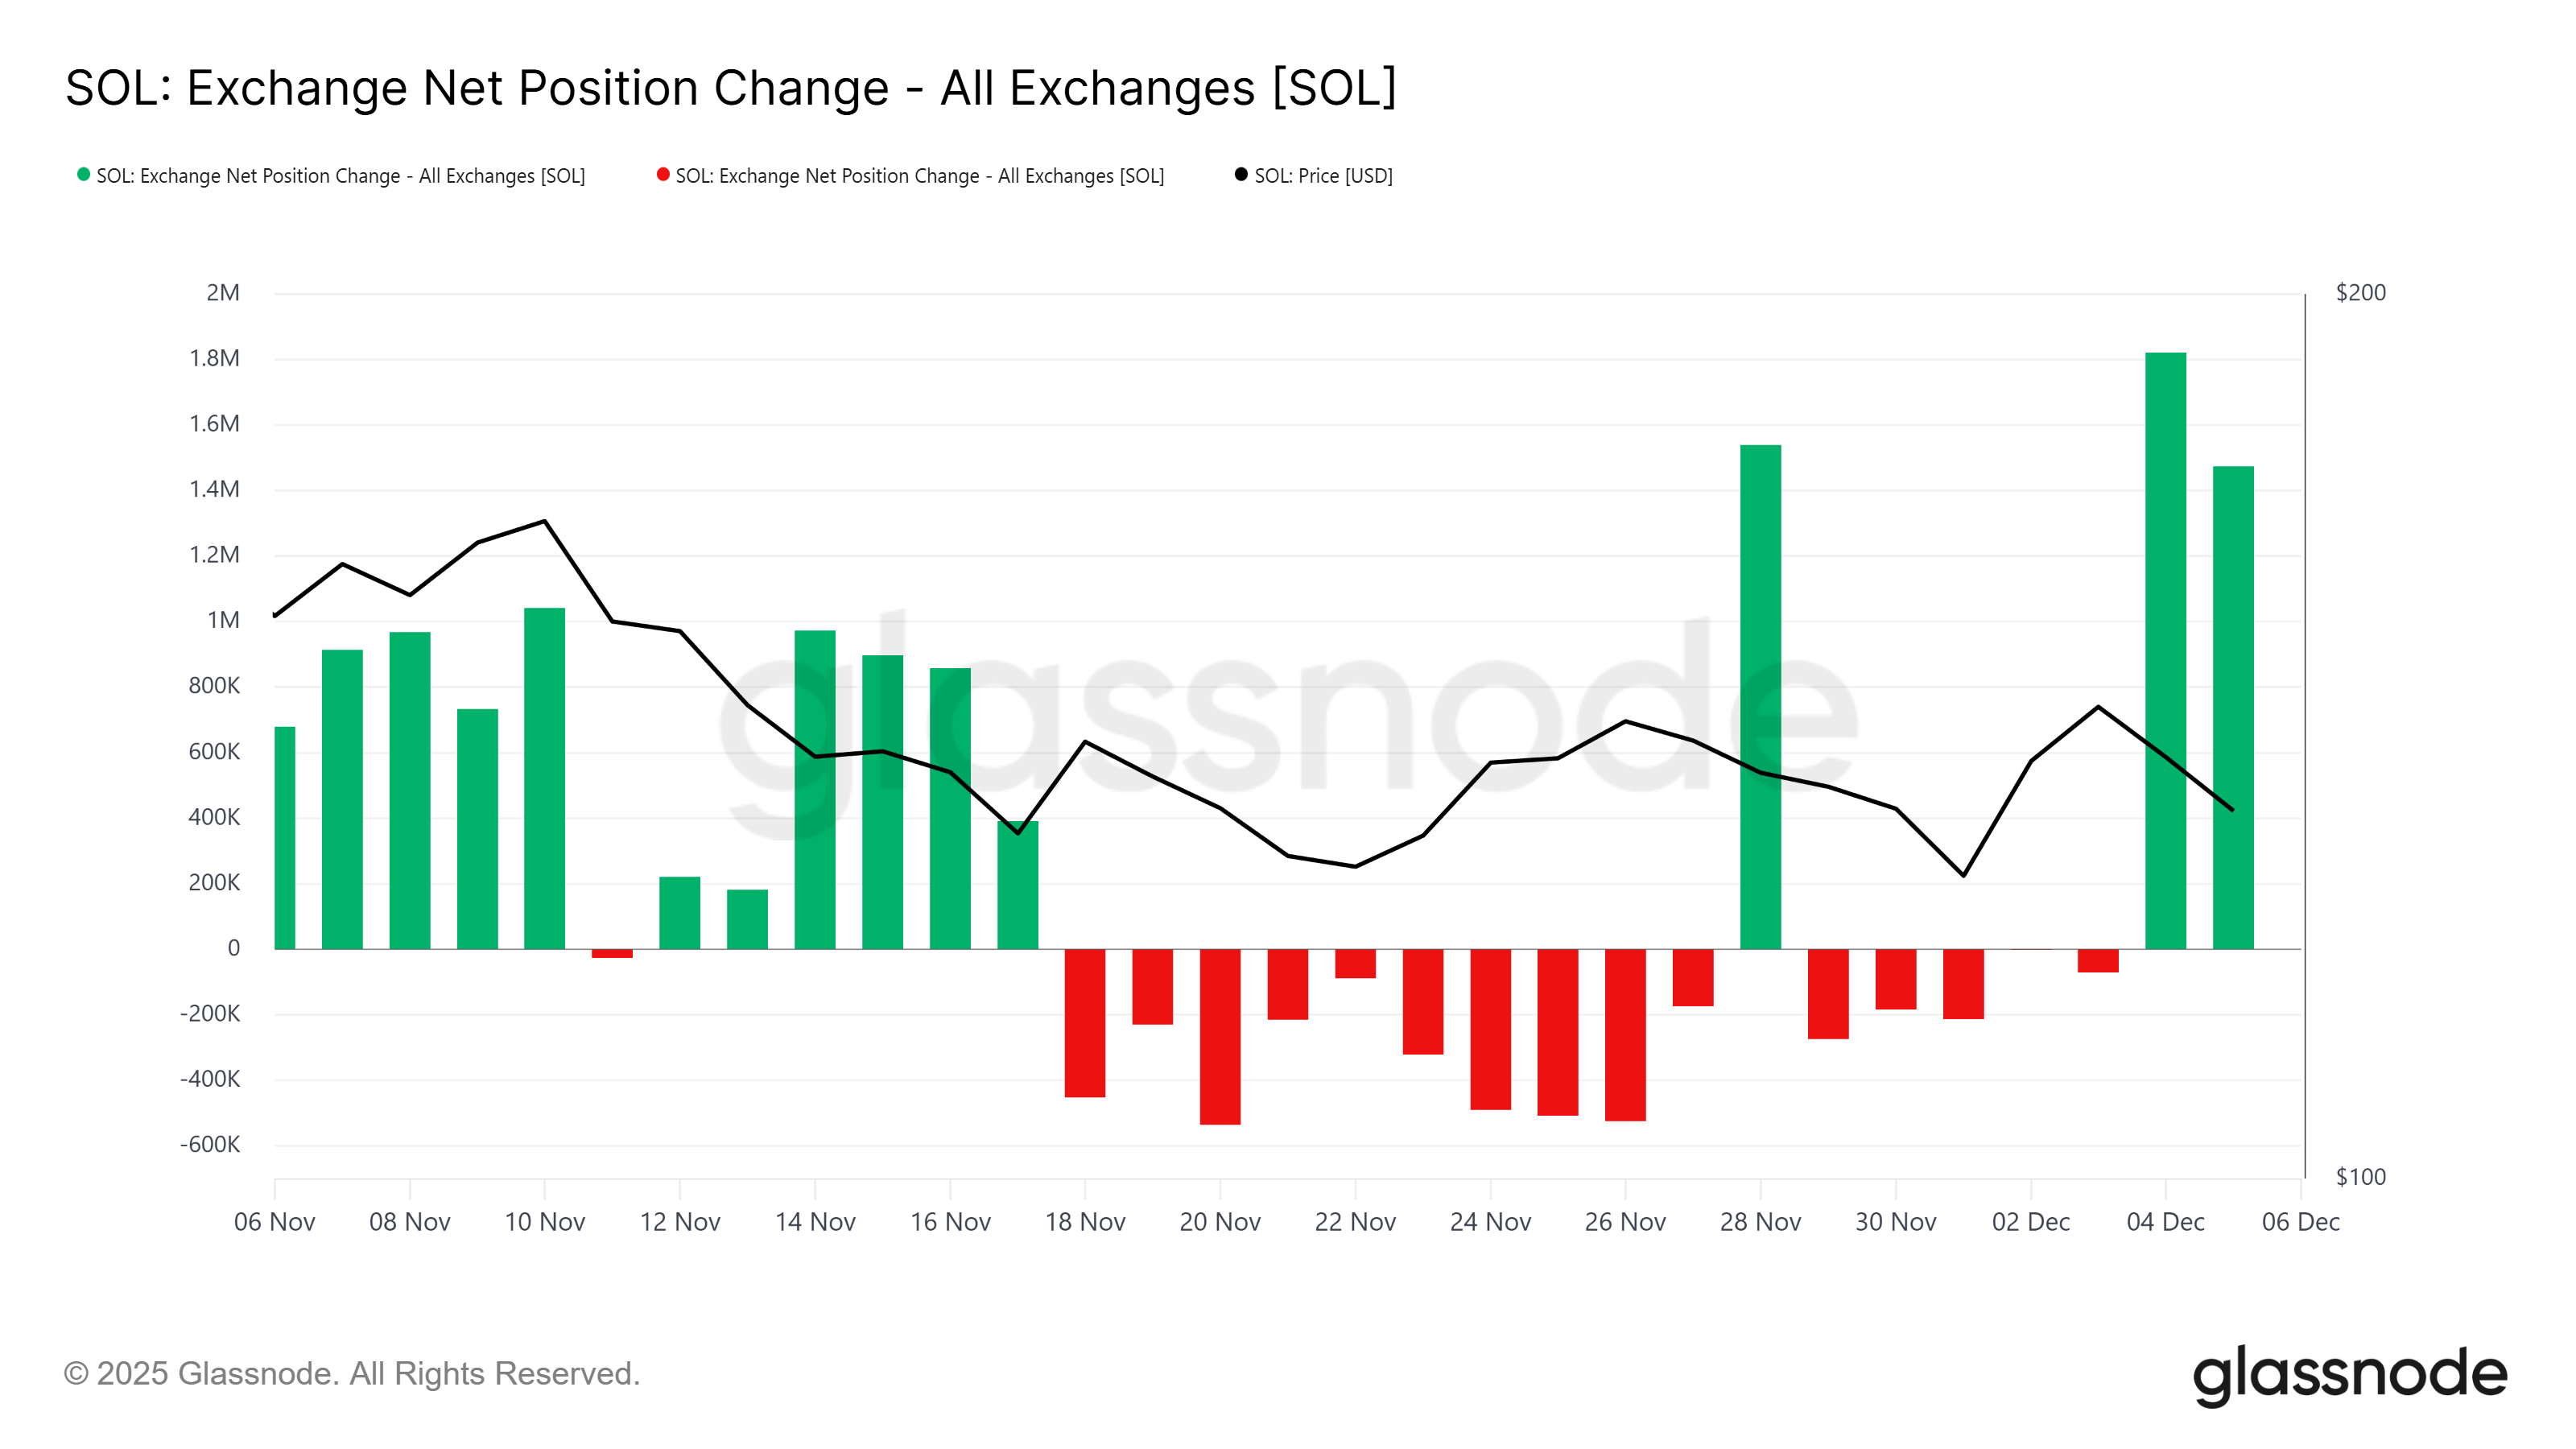 Solana Exchange Net Position. Source: Glassnode
The Realized Profit/Loss Ratio further reinforces this bearish sentiment. The indicator shows that losses are dominating Solana as holders increasingly sell at lower prices to avoid deeper drawdowns. Panic-driven exits, even on a smaller scale, point to fading confidence.
When losses dominate, price tends to face additional downward pressure unless broader sentiment shifts. At present, the macro environment suggests investors are bracing for potential declines rather than preparing for accumulation.
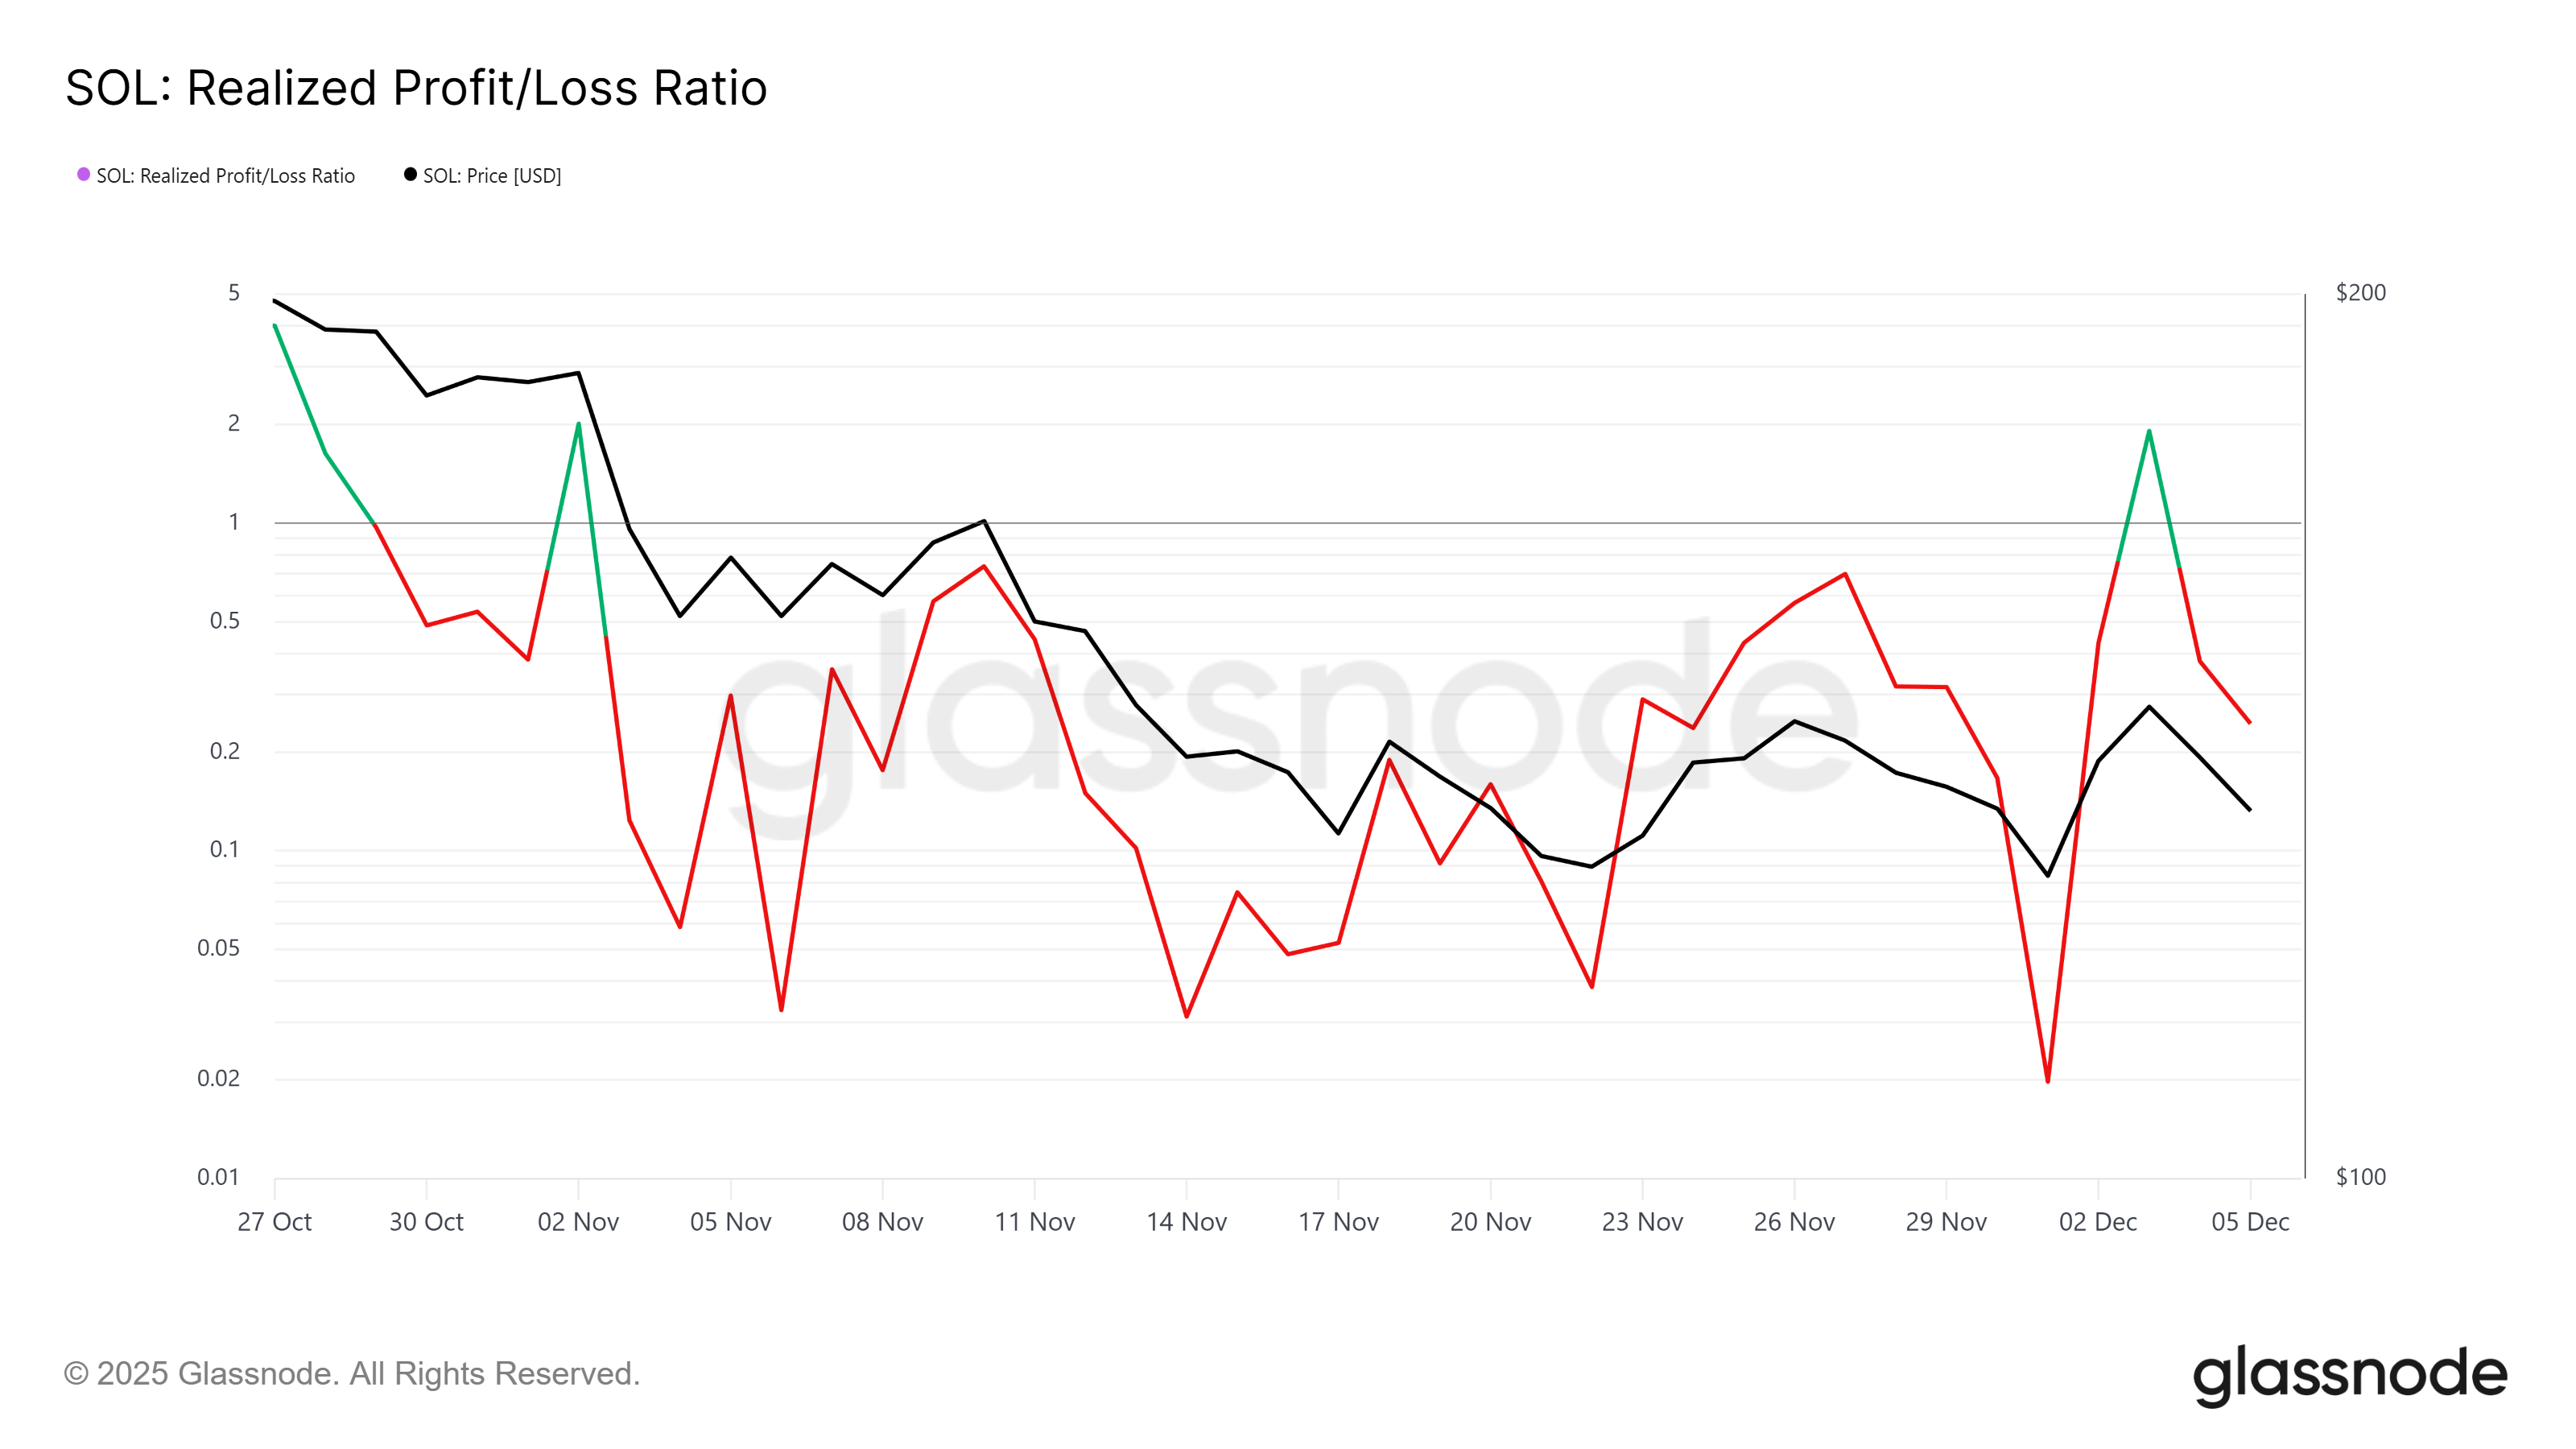 Solana Realized Profit/Loss. Source: Glassnode
SOL Price Needs To Find Direction
Solana’s price continues to trend within a descending channel after failing to break past the $146 resistance earlier this week. This structure leaves two potential paths depending on upcoming market cues and investor behavior.
If the channel remains intact and bearish sentiment persists, SOL risks falling below the lower trend line. Such a breakdown could drag the price toward $123 or even $118 if selling pressure continues to build.
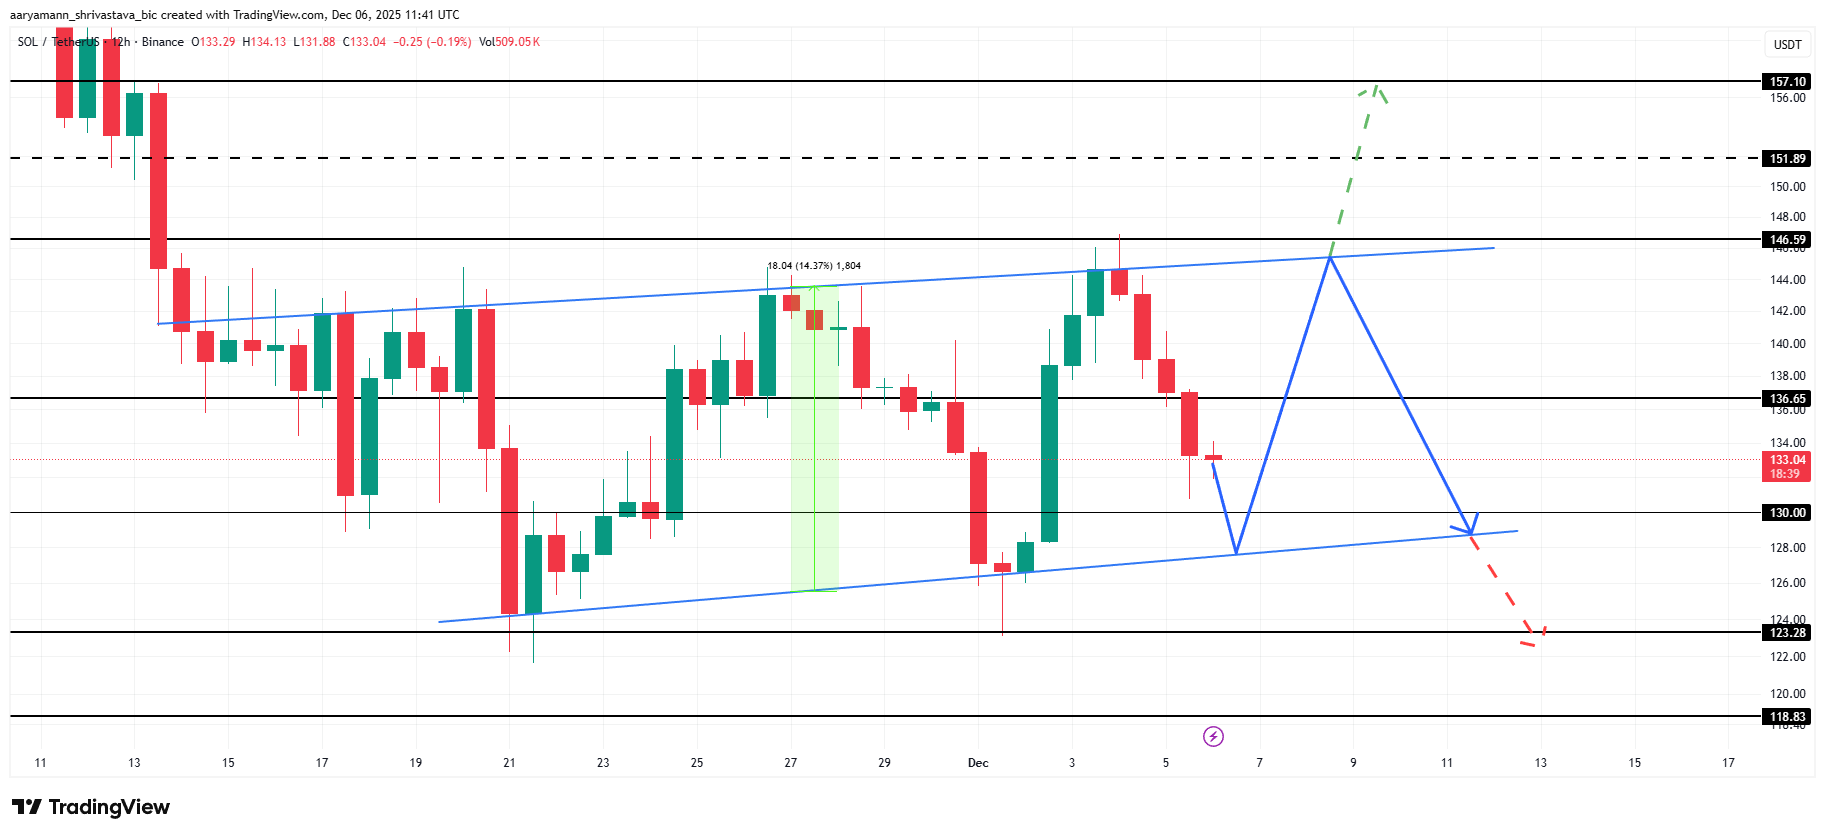 Solana Price Analysis. Source: TradingView
Alternatively, a successful bounce off the channel support could spark a recovery attempt. If SOL regains strength and challenges the $146 resistance once more, a breakout could push the price toward $151 and eventually $157.
However, this outcome requires a renewed shift to bullish market conditions to invalidate the current bearish thesis.
You May Also Like

U.S. Moves Grip on Crypto Regulation Intensifies


Polygon Tops RWA Rankings With $1.1B in Tokenized Assets
