Bitcoin price did not just dip. It reacted to something way bigger. The U.S. government revised last year’s job numbers down by nearly 900,000 positions. MarketBitcoin price did not just dip. It reacted to something way bigger. The U.S. government revised last year’s job numbers down by nearly 900,000 positions. Market

Bitcoin Price Slides After US Admits Nearly 1 Million ‘Phantom’ Jobs in Data Revision

2026/02/13 21:03
2 min read

Bitcoin price did not just dip. It reacted to something way bigger.

The U.S. government revised last year’s job numbers down by nearly 900,000 positions.

Markets hate one thing more than bad news. They hate unreliable data and uncertainty.

This update from the Bureau of Labor Statistics just shook confidence hard. January showed 130,000 new jobs. Fine on the surface. But the massive downward adjustment for 2025 changes the entire story.

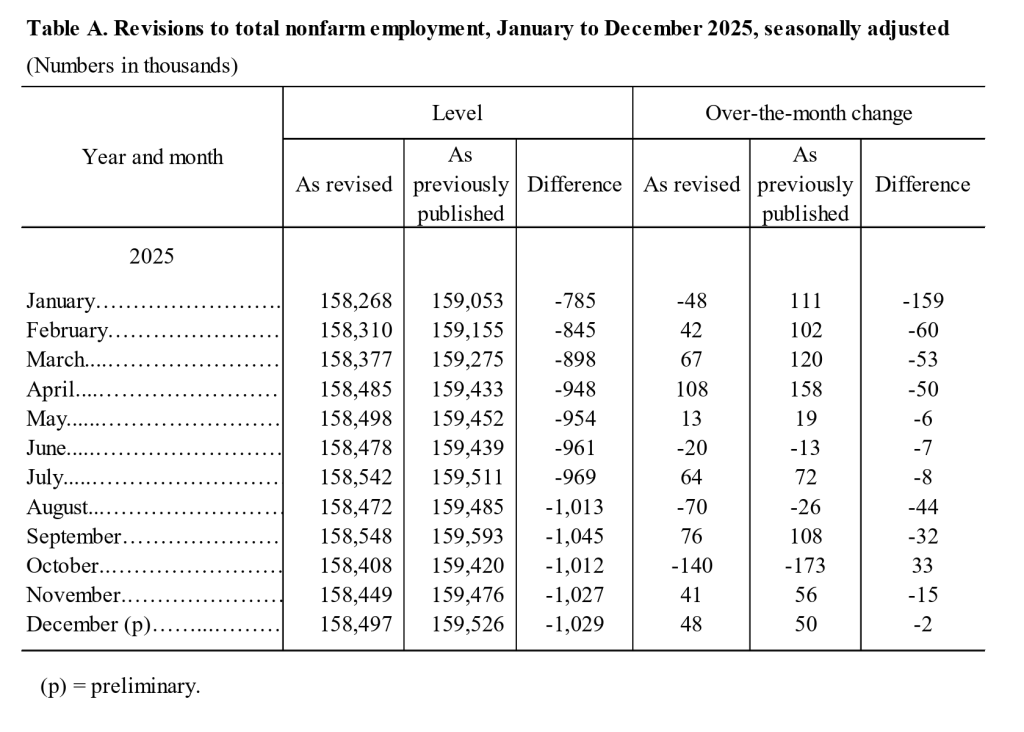
Source: Bureau of Labor

Much of the reported strength was based on preliminary estimates, including the birth–death model, which can overstate job creation during periods of economic transition.

Discover: Here are the crypto likely to explode!

What Does This Mean for Bitcoin Price?

Since this increase in uncertainty, Risk assets got hit. Treasury yields jumped, with the 10 year moving from 4.15% to 4.20%.

Uncertainty is poison for markets. You can see it in the derivatives flows. Whale perp activity is spiking, which points to institutions hedging hard against more downside.

Rate cut odds for March collapsed from 22% to 9% in minutes. That kind of shift changes the entire market mood. Add fresh warnings about volatility risks across large chunks of BTC supply and the setup gets even heavier.

Source: CMEGroup

Could this be the bottom? Maybe. But the way the market is behaving, it does not look ready to commit to that idea just yet.

Keep your eyes on the bond market. As long as yields keep pushing higher, Bitcoin will have a hard time finding stable ground. That is just how the liquidity game works.

Still, chaos has a funny way of creating opportunity.

Discover: The best pre-launch crypto sales right now.

Market Opportunity
Ucan fix life in1day Logo
Ucan fix life in1day Price(1)
$0.0006351
$0.0006351$0.0006351
-11.21%
USD
Ucan fix life in1day (1) Live Price Chart
Disclaimer: The articles reposted on this site are sourced from public platforms and are provided for informational purposes only. They do not necessarily reflect the views of MEXC. All rights remain with the original authors. If you believe any content infringes on third-party rights, please contact [email protected] for removal. MEXC makes no guarantees regarding the accuracy, completeness, or timeliness of the content and is not responsible for any actions taken based on the information provided. The content does not constitute financial, legal, or other professional advice, nor should it be considered a recommendation or endorsement by MEXC.

You May Also Like

Microsoft Corp. $MSFT blue box area offers a buying opportunity

Microsoft Corp. $MSFT blue box area offers a buying opportunity

The post Microsoft Corp. $MSFT blue box area offers a buying opportunity appeared on BitcoinEthereumNews.com. In today’s article, we’ll examine the recent performance of Microsoft Corp. ($MSFT) through the lens of Elliott Wave Theory. We’ll review how the rally from the April 07, 2025 low unfolded as a 5-wave impulse followed by a 3-swing correction (ABC) and discuss our forecast for the next move. Let’s dive into the structure and expectations for this stock. Five wave impulse structure + ABC + WXY correction $MSFT 8H Elliott Wave chart 9.04.2025 In the 8-hour Elliott Wave count from Sep 04, 2025, we saw that $MSFT completed a 5-wave impulsive cycle at red III. As expected, this initial wave prompted a pullback. We anticipated this pullback to unfold in 3 swings and find buyers in the equal legs area between $497.02 and $471.06 This setup aligns with a typical Elliott Wave correction pattern (ABC), in which the market pauses briefly before resuming its primary trend. $MSFT 8H Elliott Wave chart 7.14.2025 The update, 10 days later, shows the stock finding support from the equal legs area as predicted allowing traders to get risk free. The stock is expected to bounce towards 525 – 532 before deciding if the bounce is a connector or the next leg higher. A break into new ATHs will confirm the latter and can see it trade higher towards 570 – 593 area. Until then, traders should get risk free and protect their capital in case of a WXY double correction. Conclusion In conclusion, our Elliott Wave analysis of Microsoft Corp. ($MSFT) suggested that it remains supported against April 07, 2025 lows and bounce from the blue box area. In the meantime, keep an eye out for any corrective pullbacks that may offer entry opportunities. By applying Elliott Wave Theory, traders can better anticipate the structure of upcoming moves and enhance risk management in volatile markets. Source: https://www.fxstreet.com/news/microsoft-corp-msft-blue-box-area-offers-a-buying-opportunity-202509171323
Share
BitcoinEthereumNews2025/09/18 03:50
TON Technical Analysis Feb 14

TON Technical Analysis Feb 14

The post TON Technical Analysis Feb 14 appeared on BitcoinEthereumNews.com. Although TON’s market structure is in a general downtrend, it shows recovery above the
Share
BitcoinEthereumNews2026/02/14 13:20
Trump Media and Technology Group Files New Crypto ETFs After SEC Delay

Trump Media and Technology Group Files New Crypto ETFs After SEC Delay

TLDR Trump Media refiles Bitcoin Ethereum and Cronos ETFs after SEC delay Crypto.com and Yorkville will advise and manage the new Truth Social ETFs ETFs will include
Share
Coincentral2026/02/14 13:31