TLDR Solana (SOL) has traded in a tight $77–$88 range for nearly four weeks with no clear trend direction US spot Solana ETFs recorded over $44 million in weeklyTLDR Solana (SOL) has traded in a tight $77–$88 range for nearly four weeks with no clear trend direction US spot Solana ETFs recorded over $44 million in weekly

Solana (SOL) Price: Is a Breakout Coming After Four Weeks Stuck in the Same Range?

2026/03/02 15:55
3 min read
For feedback or concerns regarding this content, please contact us at [email protected]

TLDR

  • Solana (SOL) has traded in a tight $77–$88 range for nearly four weeks with no clear trend direction
  • US spot Solana ETFs recorded over $44 million in weekly inflows, with cumulative inflows surpassing $900 million
  • SOL futures Open Interest dropped over 6% in 24 hours, with $26.47 million in liquidations, mostly long positions
  • Bollinger Bands are squeezing, signaling a potential volatility breakout in either direction
  • Daily new Solana addresses rose by 1.4 million over 12 days, reaching 8.6 million, showing network growth

Solana (SOL) is trading around $84–$85 as of March 2, 2026, stuck in a consolidation range it has held for nearly four weeks. The price has bounced between $77 and $88 repeatedly without a decisive break in either direction.
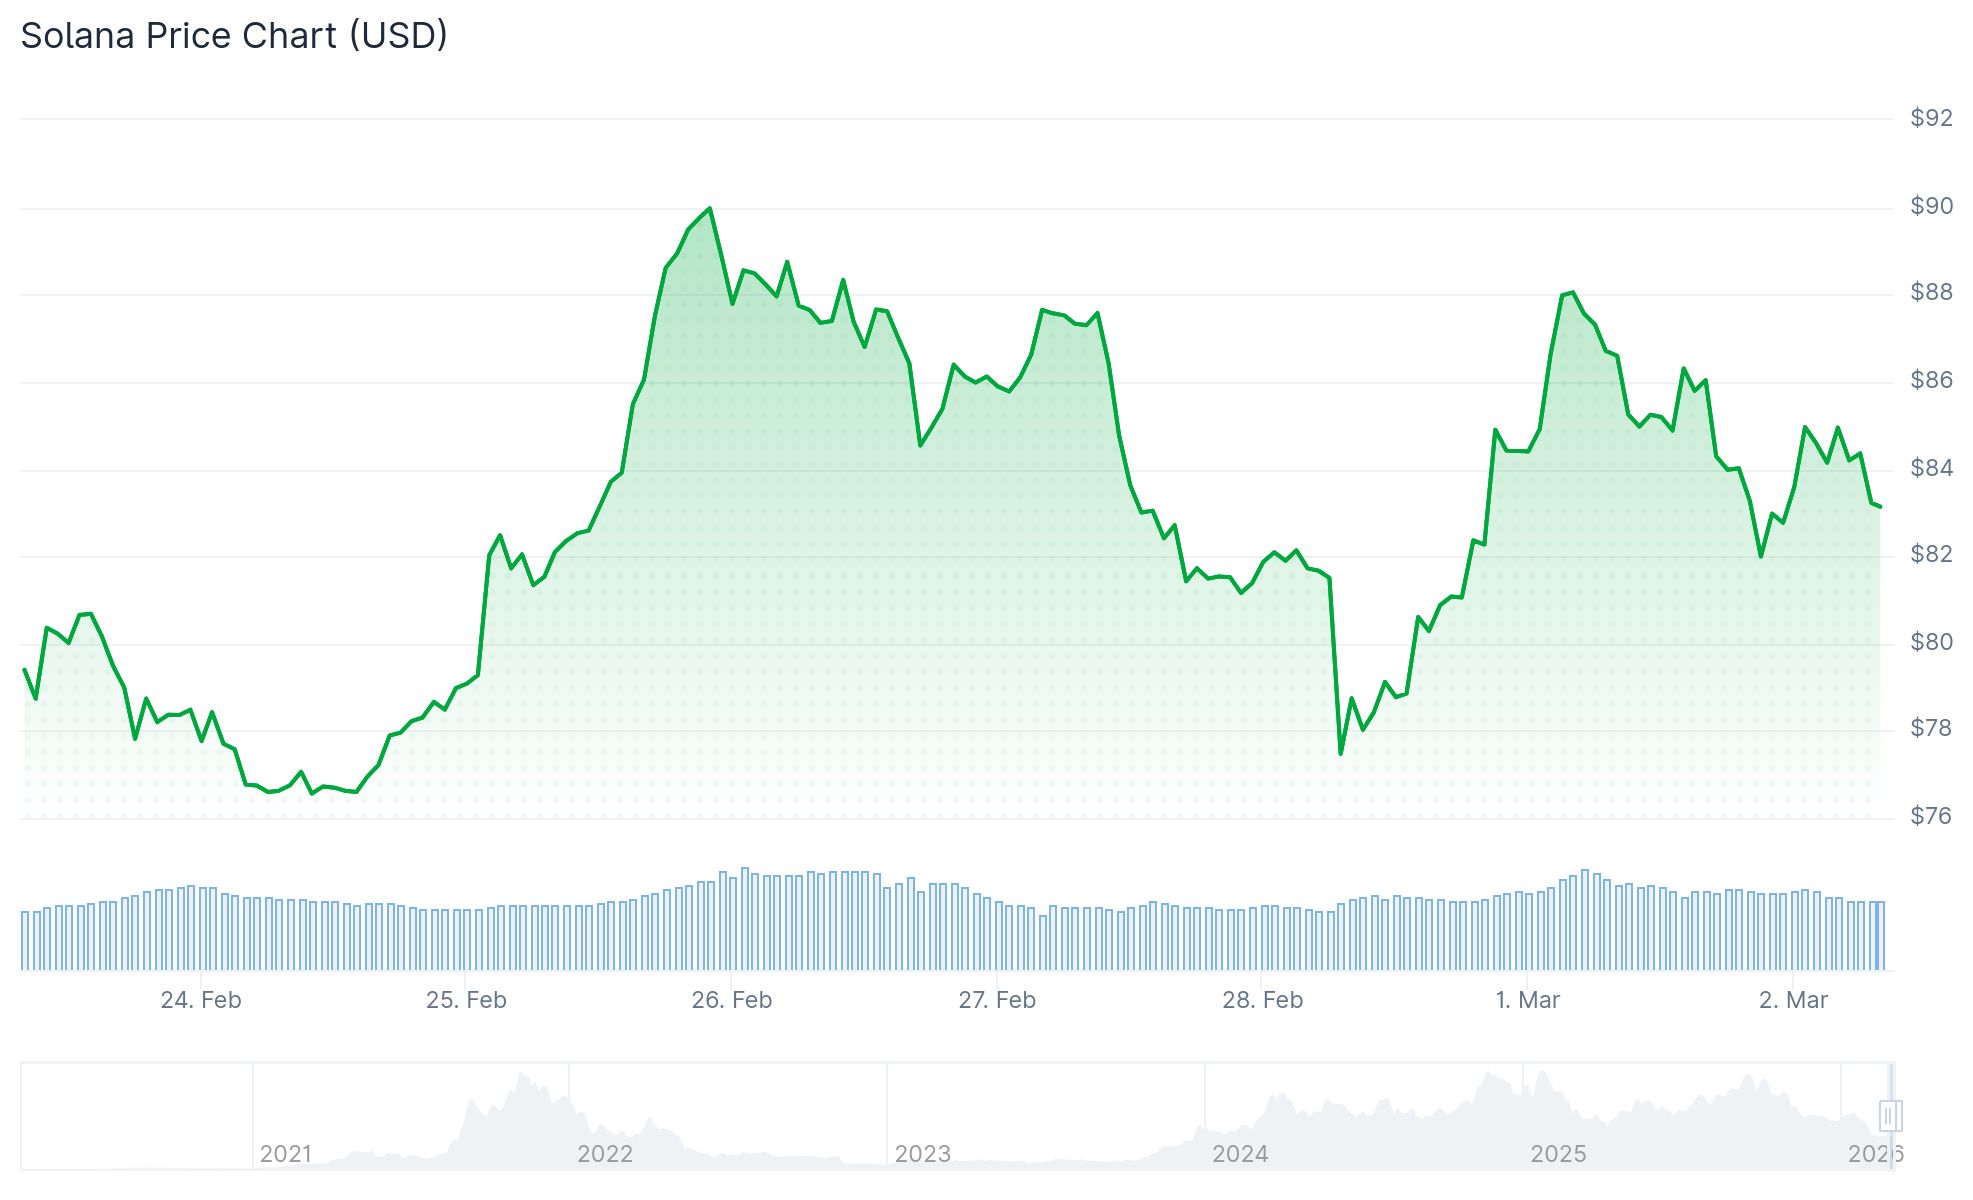
Solana (SOL) PriceSolana (SOL) Price

Despite the flat price action, institutional interest has held firm. US spot Solana ETFs recorded $44.44 million in weekly inflows last week, including $30.86 million in a single day on Wednesday.

Cumulative ETF inflows for the year have now surpassed $900 million. February saw more than 12 consecutive days of net inflows, even as Bitcoin and Ethereum ETFs recorded outflows during the same period.

Source: SoSoValue

Retail sentiment tells a different story. SOL futures Open Interest fell over 6% in 24 hours to $4.89 billion, pointing to traders closing positions.

Total liquidations hit $26.47 million in that same window, with $20.47 million coming from long positions. That points to a broad wipe of bullish bets.

Despite the liquidations, the funding rate sits at 0.0037–0.0041%, meaning leveraged traders are still paying a premium to hold long positions.

Key Technical Levels

SOL remains below its 50-day and 200-day Exponential Moving Averages, currently at $99.06 and $137.23. These levels are acting as overhead resistance.

The RSI sits at around 43, below the neutral midline of 50. The MACD histogram shows weakening bearish momentum but no bullish crossover yet.

Bollinger Bands are converging on the daily chart. This kind of squeeze often comes before a sharp price move, though the direction is not yet confirmed.

Analyst Umair Crypto noted a contrast between SOL’s USDT and BTC trading pairs. The USDT chart shows lower highs, while the BTC pair shows higher highs — a split that has lasted 24 days.

On-Chain Data Shows Network Growth

On-chain data from Glassnode shows daily new Solana addresses rose by 1.4 million over the past 12 days, reaching a total of 8.6 million. This suggests growing user engagement on the network.
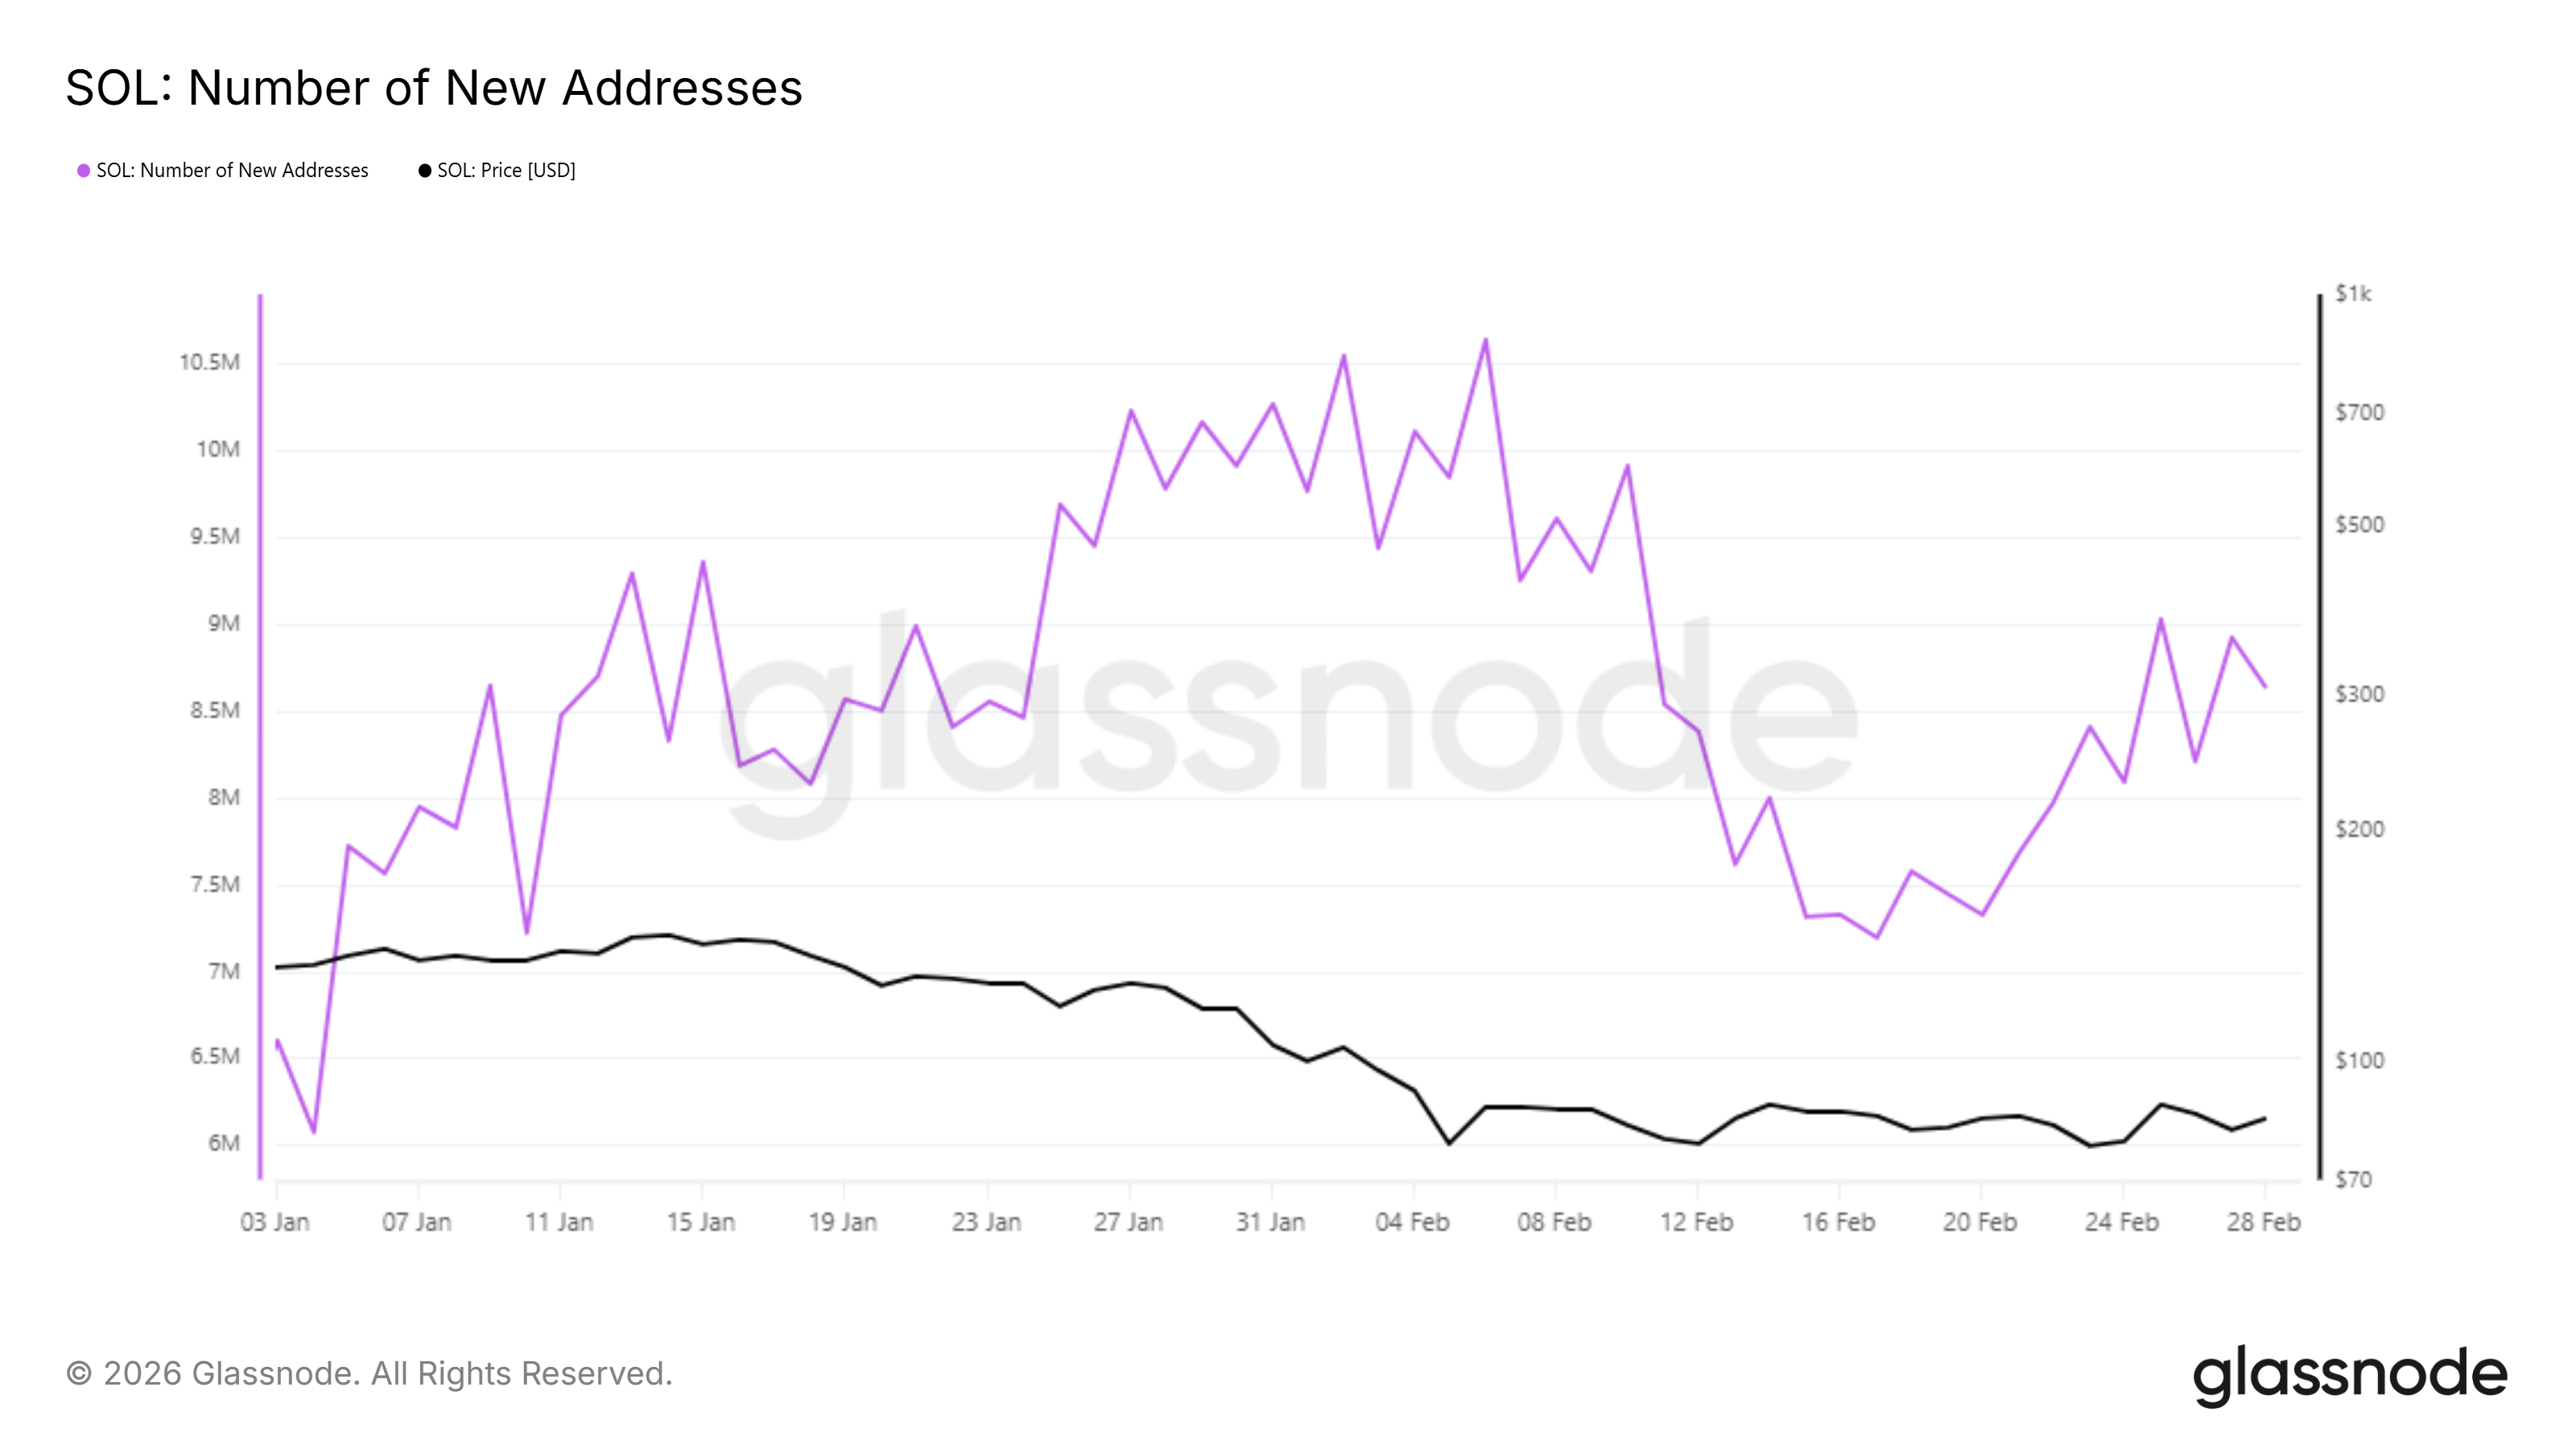
Solana New Addresses. Source: Glassnode

Long-term holders are still in net positive territory, though the pace of accumulation has slowed. Hodler net position change data shows resilience but reduced buying momentum.

If SOL clears $88 and then $93.43, the next target is the 50-day EMA near $99. A close above that opens the path toward $137.

If the price breaks below $77, the next support sits at the February 6 low of $67.50.

SOL’s trading volume dropped 5.77% to $12.20 billion, with Open Interest also down 3.73% to $4.88 billion as of the latest data.

The post Solana (SOL) Price: Is a Breakout Coming After Four Weeks Stuck in the Same Range? appeared first on CoinCentral.

Market Opportunity
Solana Logo
Solana Price(SOL)
$83.94
$83.94$83.94
-2.00%
USD
Solana (SOL) Live Price Chart
Disclaimer: The articles reposted on this site are sourced from public platforms and are provided for informational purposes only. They do not necessarily reflect the views of MEXC. All rights remain with the original authors. If you believe any content infringes on third-party rights, please contact [email protected] for removal. MEXC makes no guarantees regarding the accuracy, completeness, or timeliness of the content and is not responsible for any actions taken based on the information provided. The content does not constitute financial, legal, or other professional advice, nor should it be considered a recommendation or endorsement by MEXC.

You May Also Like

Aster Genesis Phase 2 will conclude on October 6, with Phase 3 to include spot trading volumes

Aster Genesis Phase 2 will conclude on October 6, with Phase 3 to include spot trading volumes

PANews reported on September 22nd that the decentralized exchange Aster announced that the second phase of Aster Genesis will conclude at 23:59 UTC on October 5th (07:59 Beijing Time on October 6th). With two cycles remaining, users can still trade and earn Rh points—4% of the total ASTER supply has been allocated for Phase 2 rewards. Phase 3 will follow shortly thereafter, incorporating spot trading points and updating the rewards mechanism.
Share
PANews2025/09/22 21:37
Xiaomi Stock: Flagship Phones Launch as Memory Prices Surge 80–90%

Xiaomi Stock: Flagship Phones Launch as Memory Prices Surge 80–90%

TLDR Xiaomi launched the Xiaomi 17 and 17 Ultra globally at Mobile World Congress, priced at 999 euros and 1,499 euros respectively Memory chip prices have surged
Share
Coincentral2026/03/02 18:30
GBP trades firmly against US Dollar

GBP trades firmly against US Dollar

The post GBP trades firmly against US Dollar appeared on BitcoinEthereumNews.com. Pound Sterling trades firmly against US Dollar ahead of Fed’s policy outcome The Pound Sterling (GBP) clings to Tuesday’s gains near 1.3640 against the US Dollar (USD) during the European trading session on Wednesday. The GBP/USD pair holds onto gains as the US Dollar remains on the back foot amid firm expectations that the Federal Reserve (Fed) will cut interest rates in the monetary policy announcement at 18:00 GMT. At the time of writing, the US Dollar Index (DXY), which tracks the Greenback’s value against six major currencies, holds onto losses near a fresh two-month low of 96.60 posted on Tuesday. Read more… UK inflation unchanged at 3.8%, Pound shrugs The British pound is unchanged on Wednesday, trading at 1.3645 in the European session. Today’s inflation report was a dour reminder that UK inflation remains entrenched. CPI for August was unchanged at 3.8% y/y, matching the consensus and its highest level since January 2024. Airfares decreased but this was offset by food and petrol prices. Monthly, CPI rose 0.3%, up from 0.1% in July and matching the consensus. Core CPI, which excludes volatile items such as food and energy, eased to 3.6% from 3.8%. Monthly, core CPI ticked up to 0.3% from 0.2%. The inflation report comes just a day before the Bank of England announces its rate decision. Inflation is almost double the BoE’s target of 2% and today’s release likely means that the BoE will not reduce rates before 2026. Read more… Source: https://www.fxstreet.com/news/pound-sterling-price-news-and-forecast-gbp-trades-firmly-against-us-dollar-ahead-of-feds-policy-outcome-202509171209
Share
BitcoinEthereumNews2025/09/18 01:50