Solana’s price sits at a crucial crossroads as rising U.S. unemployment pressures the Fed to cut rates again.Solana’s price sits at a crucial crossroads as rising U.S. unemployment pressures the Fed to cut rates again.

Solana Price Prediction: Can Fed Rate Cuts Revive the SOL Rally?

The U.S. Federal Reserve’s latest rate-cut campaign has given new hope to risk assets, and Solana investors are watching closely to see if that optimism can translate into price action. With unemployment creeping higher and economic data turning soft, the market’s focus has shifted from fighting inflation to reviving growth. The question now is whether this macro tailwind can lift Solana price out of its multi-week slump.

Solana Price Prediction: Jobs Data Keeps the Fed on Edge

The November jobs report showed unemployment rising to 4.6%, its highest level since 2021. That has reinforced expectations that the Fed may continue cutting rates through early 2026. Historically, lower borrowing costs have injected liquidity into crypto markets, allowing investors to rotate capital back into riskier assets like Solana.

However, the tone from policymakers remains mixed. Some Fed officials are calling for patience to see how previous cuts impact inflation, while others argue for faster easing to avoid a deeper labor slowdown. This split has kept markets uncertain — and Solana’s price reflects that hesitation.

If the Fed signals a January rate cut, the crypto market could see a short-term risk-on bounce, as cheaper credit typically pushes speculative flows higher. But if policymakers pause to assess, Solana price may remain stuck in its consolidation phase for longer.

Solana Price Prediction: SOL Price Struggles Below the Mid-Band

Solana Price Prediction
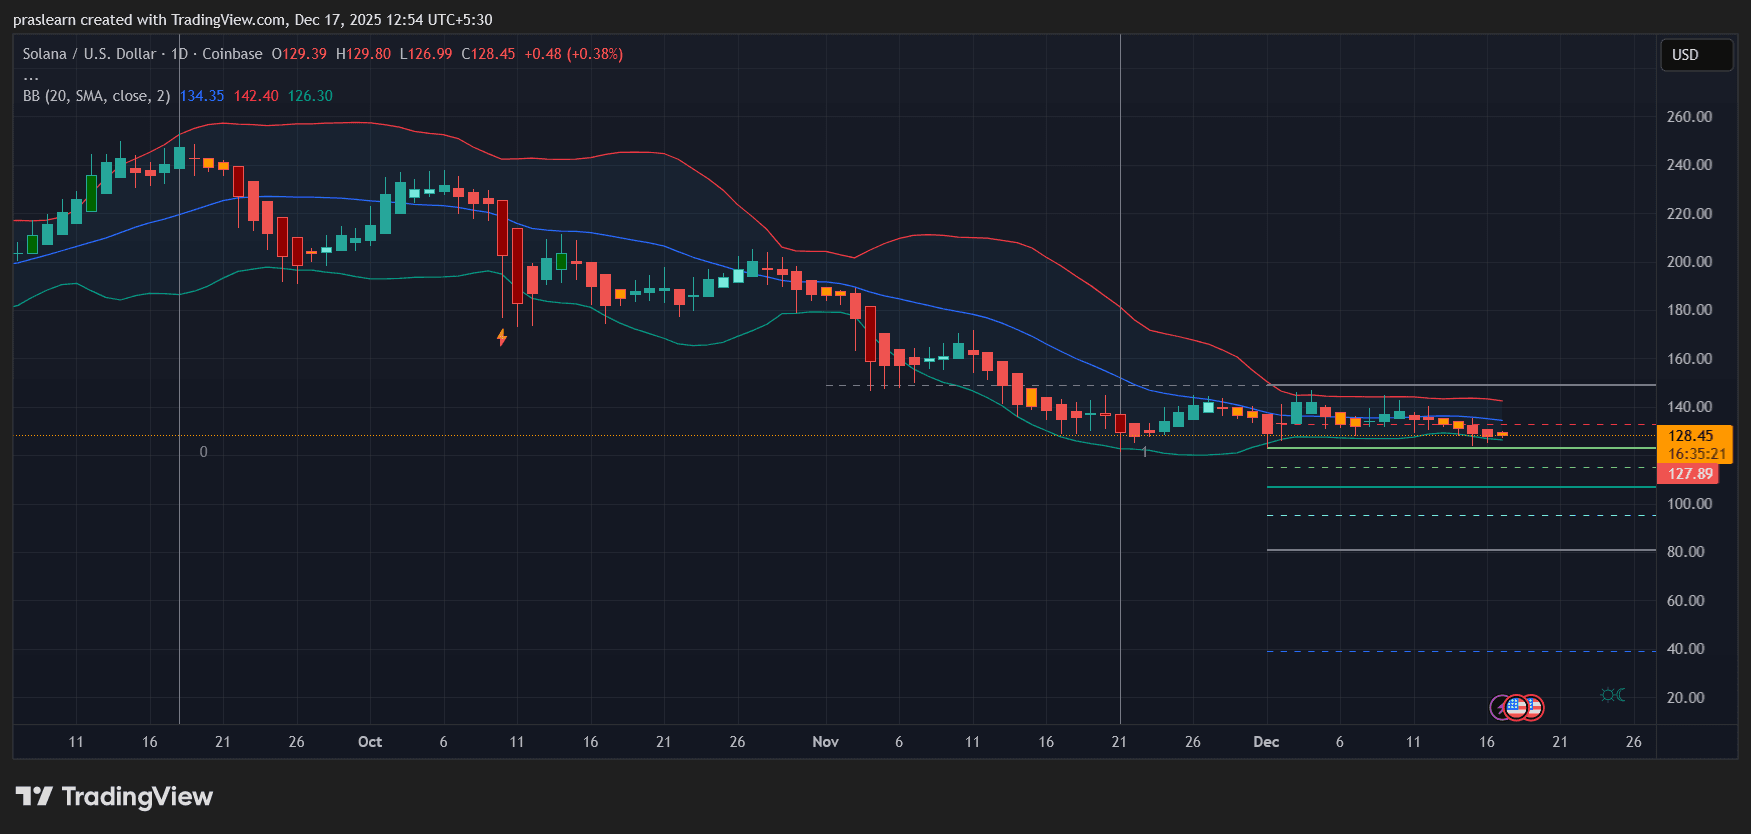
SOL/USD Daily Chart- TradingView

Looking at the daily TradingView chart, SOL price trades around $128, hugging the lower Bollinger Band and sitting below the 20-day simple moving average (around $134). The price structure has been in a consistent downtrend since October, with lower highs and persistent resistance near $140.

The Bollinger Bands remain narrow, showing volatility compression — a setup that often precedes a strong breakout. But for now, the breakout direction remains uncertain. The bears are defending the mid-band firmly, suggesting that sentiment hasn’t turned bullish yet.

Support zones lie near $120 and $108, both of which align with prior demand clusters and the lower band extension. A clean close below $120 could open the door to a deeper correction toward the $100–$105 zone. Conversely, if Solana price manages to break and close above $136–$140, the short-term trend could flip bullish, targeting $155–$160 as the next resistance range.

Momentum and Market Psychology

Volume has been declining alongside the price, a classic sign of exhaustion but not necessarily reversal. Momentum indicators are neutral, showing indecision rather than strength. Traders appear to be waiting for a catalyst — either confirmation of further rate cuts or a strong risk-on move across the crypto sector.

Historically, Solana price has been one of the fastest to react when market liquidity improves. During the previous Fed easing cycle, SOL price outperformed most large-cap altcoins once confidence returned. The setup today looks similar, but patience will be key. Until macro data gives the all-clear, large funds are unlikely to rotate heavily into altcoins.

Solana Price Prediction: Accumulation or Breakdown Ahead?

Over the next few weeks, Solana price trajectory hinges on two triggers — the Fed’s January decision and broader crypto market sentiment. If the Fed leans dovish and confirms another rate cut, SOL price could quickly rebound toward the $150–$160 zone. But if the Fed pauses amid persistent inflation concerns, the market may interpret it as a warning signal, leaving Solana vulnerable to retesting the $100–$110 range.

For now, the technical bias remains mildly bearish but nearing potential accumulation territory. Long-term investors might view the $110–$120 zone as a value area, while traders should watch for a breakout above $136 as the first sign of renewed strength.

Solana’s fate is tied to macro liquidity just as much as its on-chain momentum. The Fed’s rate policy in early 2026 could decide whether $SOL resumes its rally or extends its correction. The chart suggests a compressed, low-volatility phase that’s ready to expand — and once the Fed’s next move becomes clearer, Solana price will likely be among the first altcoins to react.

Market Opportunity
Revive Finance Logo
Revive Finance Price(REVIVE)
$0.000333
$0.000333$0.000333
0.00%
USD
Revive Finance (REVIVE) Live Price Chart
Disclaimer: The articles reposted on this site are sourced from public platforms and are provided for informational purposes only. They do not necessarily reflect the views of MEXC. All rights remain with the original authors. If you believe any content infringes on third-party rights, please contact [email protected] for removal. MEXC makes no guarantees regarding the accuracy, completeness, or timeliness of the content and is not responsible for any actions taken based on the information provided. The content does not constitute financial, legal, or other professional advice, nor should it be considered a recommendation or endorsement by MEXC.

You May Also Like

Egrag Crypto: XRP Could be Around $6 or $7 by Mid-November Based on this Analysis

Egrag Crypto: XRP Could be Around $6 or $7 by Mid-November Based on this Analysis

Egrag Crypto forecasts XRP reaching $6 to $7 by November. Fractal pattern analysis suggests a significant XRP price surge soon. XRP poised for potential growth based on historical price patterns. The cryptocurrency community is abuzz after renowned analyst Egrag Crypto shared an analysis suggesting that XRP could reach $6 to $7 by mid-November. This prediction is based on the study of a fractal pattern observed in XRP’s past price movements, which the analyst believes is likely to repeat itself in the coming months. According to Egrag Crypto, the analysis hinges on fractal patterns, which are used in technical analysis to identify recurring market behavior. Using the past price charts of XRP, the expert has found a certain fractal that looks similar to the existing market structure. The trend indicates that XRP will soon experience a great increase in price, and the asset will probably reach the $6 or $7 range in mid-November. The chart shared by Egrag Crypto points to a rising trend line with several Fibonacci levels pointing to key support and resistance zones. This technical structure, along with the fractal pattern, is the foundation of the price forecast. As XRP continues to follow the predicted trajectory, the analyst sees a strong possibility of it reaching new highs, especially if the fractal behaves as expected. Also Read: Why XRP Price Remains Stagnant Despite Fed Rate Cut #XRP – A Potential Similar Set-Up! I've been analyzing the yellow fractal from a previous setup and trying to fit it into various formations. Based on the fractal formation analysis, it suggests that by mid-November, #XRP could be around $6 to $7! Fractals can indeed be… pic.twitter.com/HmIlK77Lrr — EGRAG CRYPTO (@egragcrypto) September 18, 2025 Fractal Analysis: The Key to XRP’s Potential Surge Fractals are a popular tool for market analysis, as they can reveal trends and potential price movements by identifying patterns in historical data. Egrag Crypto’s focus on a yellow fractal pattern in XRP’s price charts is central to the current forecast. Having contrasted the market scenario at the current period and how it was at an earlier time, the analyst has indicated that XRP might revert to the same price scenario that occurred at a later cycle in the past. Egrag Crypto’s forecast of $6 to $7 is based not just on the fractal pattern but also on broader market trends and technical indicators. The Fibonacci retracements and extensions will also give more insight into the price levels that are likely to be experienced in the coming few weeks. With mid-November in sight, XRP investors and traders will be keeping a close eye on the market to see if Egrag Crypto’s analysis is true. If the price targets are reached, XRP could experience one of its most significant rallies in recent history. Also Read: Top Investor Issues Advance Warning to XRP Holders – Beware of this Risk The post Egrag Crypto: XRP Could be Around $6 or $7 by Mid-November Based on this Analysis appeared first on 36Crypto.
Share
Coinstats2025/09/18 18:36
Moto completes $1.8 million pre-seed funding round for its Solana eco-credit card project.

Moto completes $1.8 million pre-seed funding round for its Solana eco-credit card project.

PANews reported on December 17th that Moto, an on-chain credit card project, announced the completion of a $1.8 million Pre-Seed funding round, led by Eterna Capital
Share
PANews2025/12/17 22:15
Why Investors Choose Pepeto As 2025’s Best Crypto: The Next Bitcoin Story

Why Investors Choose Pepeto As 2025’s Best Crypto: The Next Bitcoin Story

Desks still pass that story around because it’s proof that one coin can change everything. And the question that always […] The post Why Investors Choose Pepeto As 2025’s Best Crypto: The Next Bitcoin Story appeared first on Coindoo.
Share
Coindoo2025/09/18 04:39