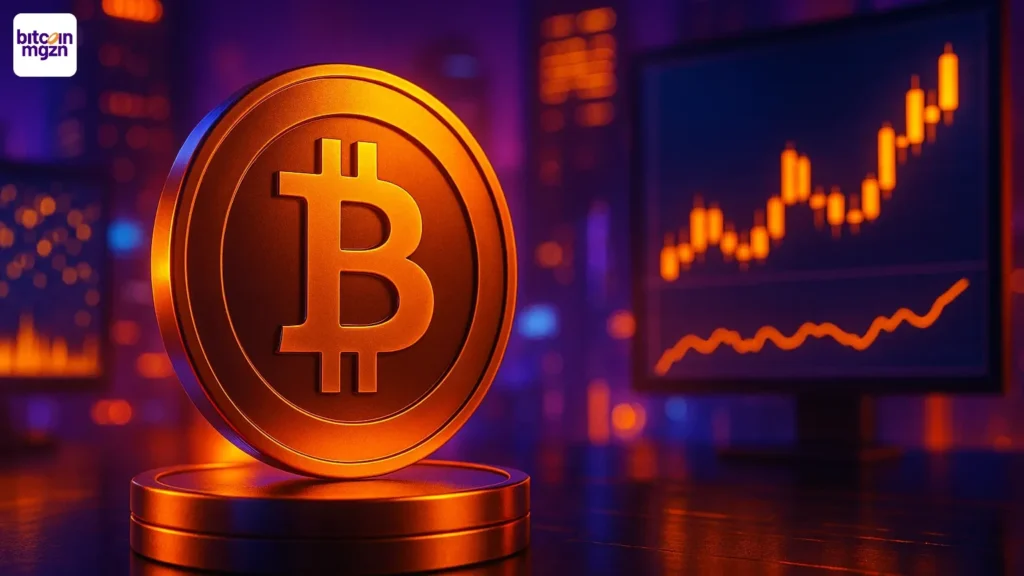
PIPPIN memecoin has surged 59% in the past day, reaching a market cap of $233.53 million from a recent low of $22 million, driven by whale accumulation and rising retail interest in the memecoin sector.
-
PIPPIN’s rally breaks long-term resistance, signaling a strong recovery in mid-cap memecoins.
-
Whale wallets accumulated $19 million, coordinating buys via centralized exchanges.
-
Trading volume exceeded $49 million, with open interest up 38%, indicating sustained momentum.
PIPPIN memecoin surges 59% amid whale buys: Explore the rally’s drivers, on-chain signals, and what it means for memecoin investors seeking the next big opportunity.
What is driving the PIPPIN memecoin’s 59% price rally?
PIPPIN memecoin has experienced a remarkable 59% price increase over the past 24 hours, propelled by renewed trader interest in mid-cap memecoins following weeks of subdued activity. At press time, its market capitalization stands at $233.53 million, a 33% jump from a November 21 low near $22 million, as it decisively breaks through prior resistance levels with consistent upward momentum. This surge reflects a broader rotation into memecoins, positioning PIPPIN as a standout performer in the sector’s recovery.
Technical indicators on daily charts underscore this shift, with the token reclaiming key long-term resistance zones not tested since earlier in 2025. Momentum candles are extending into higher territories, lending credibility to the rally’s potential for continuation. Traders monitoring these patterns note that such breakouts often precede extended uptrends in volatile assets like memecoins.
Source: TradingView
How are whale activities influencing PIPPIN’s on-chain dynamics?
Data from BubbleMaps reveals coordinated whale accumulation, with 50 connected wallets purchasing $19 million worth of PIPPIN in synchronized transactions funded by HTX exchange. These addresses, showing minimal prior activity, suggest a deliberate strategy by large holders to build positions quietly. This influx aligns with a broader pattern where 26 addresses withdrew 44% of PIPPIN supply from Gate exchange over the past two months, totaling $96 million, primarily from newly funded wallets on dates like October 24 and November 23.
Such structured withdrawals from centralized exchanges often indicate high conviction among institutional or high-net-worth traders. According to on-chain analysts, this level of accumulation precedes significant price movements by providing liquidity and reducing sell pressure. Retail participation has amplified these efforts, with trading volumes spiking to over $49 million and open interest climbing 38%, as reported by CoinGlass. This synchronization between whales and retail creates a reinforcing cycle, deepening liquidity and supporting the token’s advance.
Source: Bubblemaps
Source: Bubblemaps
Experts in cryptocurrency analytics emphasize that when whale and retail flows align, it stabilizes trends and attracts further capital. “Coordinated buys like these are classic signs of smart money positioning for upside,” notes a blockchain data specialist from a leading on-chain firm. This activity not only bolsters PIPPIN’s price but also enhances its visibility in the competitive memecoin landscape.
Frequently Asked Questions
What caused PIPPIN memecoin’s market cap to jump 33% recently?
PIPPIN’s market cap rose 33% to $233.53 million due to aggressive buying from whales and retail traders breaking key resistance levels. After accumulating quietly from November lows near $22 million, the token’s rally gained traction with synchronized $19 million inflows, as tracked by BubbleMaps, signaling strong sector recovery.
Is PIPPIN’s current rally sustainable based on on-chain metrics?
Yes, PIPPIN’s rally shows sustainability through surging volumes over $49 million and 38% higher open interest per CoinGlass data. Whale accumulations and retail engagement are creating balanced buying pressure, with momentum indicators confirming breaks above long-term resistance for potential continued growth.
Source: CoinGlass
The interplay of spot and leveraged trading has further entrenched this upward trajectory, with buyers maintaining dominance in recent sessions. As liquidity pools expand, PIPPIN positions itself favorably against peers in the memecoin category, where volatility remains a defining feature.
Key Takeaways
- PIPPIN’s 59% surge: Driven by whale coordination and retail volume, reclaiming resistance for mid-cap memecoin leadership.
- On-chain strength: $19 million accumulations and 38% OI rise indicate aligned market forces supporting sustained momentum.
- Investor insight: Monitor liquidity zones for breakout potential, as heavy exchange withdrawals signal long-term conviction.
Conclusion
The PIPPIN memecoin rally exemplifies the memecoin sector’s resilience, with whale activities and on-chain metrics like rising open interest and trading volumes underscoring its 59% gain to a $233.53 million market cap. As traders rotate into mid-caps, structured accumulations from platforms like HTX and Gate highlight growing confidence. Looking ahead, sustained buyer aggression could unlock higher liquidity, offering memecoin enthusiasts a prime window to track this evolving trend.
Source: https://en.coinotag.com/pippin-memecoin-rallies-59-amid-whale-accumulation-and-rising-retail-volume